Topic example of chi square test: The chi-square test is a fundamental statistical tool used to determine the association between categorical variables. This comprehensive guide provides detailed examples, steps for calculation, and applications to help you understand and effectively use the chi-square test in various scenarios.
Table of Content
- Chi-Square Test Examples
- Introduction
- What is a Chi-Square Test?
- Types of Chi-Square Tests
- When to Use a Chi-Square Test?
- Steps to Perform a Chi-Square Test
- Example of Chi-Square Test of Independence
- Example of Chi-Square Goodness-of-Fit Test
- Applications of Chi-Square Test
- Common Mistakes and Assumptions
- Conclusion
- Frequently Asked Questions (FAQs)
- YOUTUBE: Xem video này để hiểu rõ hơn về Kiểm Định Chi Bình Phương và cách áp dụng nó trong các ví dụ cụ thể.
Chi-Square Test Examples
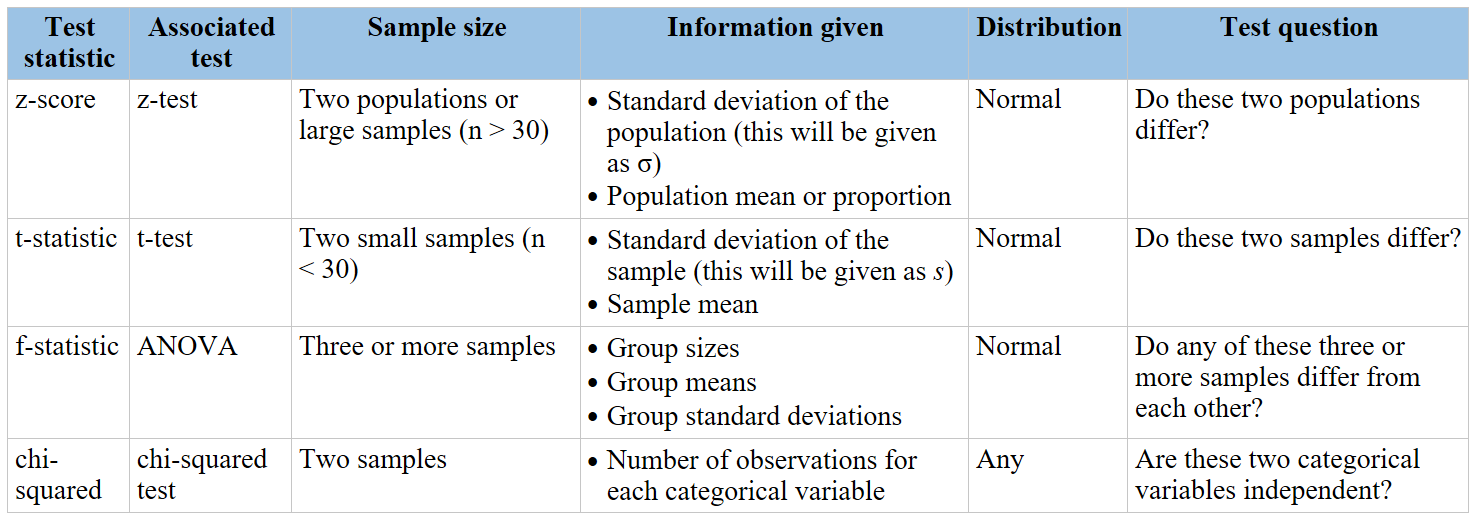
The Chi-Square test is a statistical method used to determine if there is a significant association between categorical variables. There are two main types of Chi-Square tests: the Chi-Square Goodness of Fit test and the Chi-Square Test of Independence.
Chi-Square Goodness of Fit Test
This test determines if a single categorical variable follows a hypothesized distribution.
Example 1: Testing Dice Fairness
Suppose a researcher rolls a die 50 times to check if each number appears with equal frequency.
| Outcome | Observed Frequency (O) | Expected Frequency (E) | (O - E) | (O - E)^2 | (O - E)^2 / E |
| 1 | 8 | 8.33 | -0.33 | 0.11 | 0.01 |
| 2 | 9 | 8.33 | 0.67 | 0.45 | 0.05 |
| 3 | 10 | 8.33 | 1.67 | 2.79 | 0.33 |
| 4 | 7 | 8.33 | -1.33 | 1.77 | 0.21 |
| 5 | 6 | 8.33 | -2.33 | 5.43 | 0.65 |
| 6 | 10 | 8.33 | 1.67 | 2.79 | 0.33 |
| Total | 1.58 | ||||
Using the Chi-Square formula: \( X^2 = \sum \frac{(O - E)^2}{E} = 1.58 \)
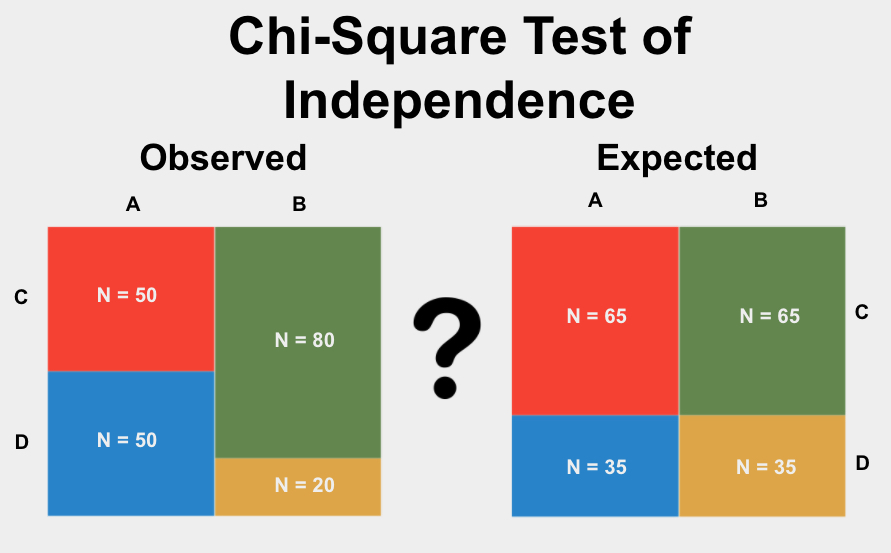
Chi-Square Test of Independence
This test determines if there is a significant association between two categorical variables.
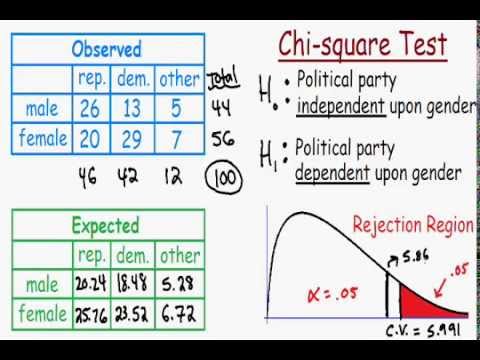
Example 2: Voting Preference and Gender
Researchers want to see if gender is associated with political party preference. They survey 500 voters and record their gender and political party preference.
| Gender | Party A | Party B | Total |
| Male | 120 | 80 | 200 |
| Female | 100 | 200 | 300 |
| Total | 220 | 280 | 500 |
Calculate expected frequencies:
Expected frequency for Male and Party A: \( \frac{(200 \times 220)}{500} = 88 \)
| Gender | Party A (E) | Party B (E) |
| Male | 88 | 112 |
| Female | 132 | 168 |
Calculate \( X^2 \):
\( X^2 = \sum \frac{(O - E)^2}{E} = \frac{(120 - 88)^2}{88} + \frac{(80 - 112)^2}{112} + \frac{(100 - 132)^2}{132} + \frac{(200 - 168)^2}{168} \)
By calculating, \( X^2 = 16.91 \). Since the critical value at 1 degree of freedom and 0.05 significance level is 3.84, we reject the null hypothesis and conclude that there is a significant association between gender and political party preference.
:max_bytes(150000):strip_icc()/Chi-SquareStatistic_Final_4199464-7eebcd71a4bf4d9ca1a88d278845e674.jpg)
READ MORE:
Introduction
The chi-square test is a statistical method commonly used to determine if there is a significant association between categorical variables. This non-parametric test is essential for analyzing data that does not follow a normal distribution, particularly when dealing with frequencies and counts. There are two primary types of chi-square tests: the chi-square goodness of fit test and the chi-square test of independence.
The chi-square goodness of fit test evaluates whether the observed frequency distribution of a single categorical variable matches an expected distribution. For instance, this test can determine if the distribution of bird species visiting a feeder aligns with expected proportions.
The chi-square test of independence, on the other hand, assesses whether two categorical variables are related. This test is useful in various fields, such as determining if gender is associated with political party preference.
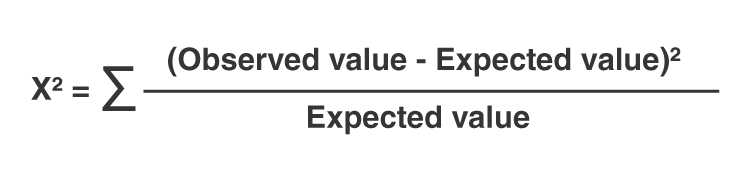
Both types of chi-square tests use the formula:
\[
\chi^2 = \sum \frac{(O - E)^2}{E}
\]
Where \( O \) represents the observed frequency, \( E \) the expected frequency, and the summation is over all categories.
In practice, chi-square tests require data to be randomly sampled and observations to be independent. Additionally, the expected frequency in each category should be at least five to ensure the test's validity. This makes chi-square tests powerful tools for hypothesis testing in various research scenarios.
What is a Chi-Square Test?
A Chi-Square Test is a statistical method used to determine if there is a significant association between two categorical variables. It evaluates how likely it is that any observed difference between the sets occurred by chance.
There are two main types of Chi-Square Tests:
- Chi-Square Test of Independence: This test assesses whether two categorical variables are independent. It is used to determine if there is a significant relationship between the variables.
- Chi-Square Goodness of Fit Test: This test determines whether a sample data matches a population with a specific distribution. It is used to see if the sample data fits a distribution from a population.
The Chi-Square Test is widely used in hypothesis testing and is particularly useful for survey data. Researchers in fields such as marketing, political science, and social sciences frequently use it to analyze categorical data.
The formula for the Chi-Square statistic is:
\[
\chi^2 = \sum \frac{(O_i - E_i)^2}{E_i}
\]
Where \(O_i\) is the observed frequency, and \(E_i\) is the expected frequency under the null hypothesis. The calculated Chi-Square statistic is then compared to a critical value from the Chi-Square distribution table, which is based on the desired confidence level and degrees of freedom.
Degrees of freedom for the Chi-Square Test of Independence are calculated as:
\[
df = (r - 1) \times (c - 1)
\]
Where \(r\) is the number of rows and \(c\) is the number of columns in the contingency table.
The Chi-Square Test helps in determining whether observed data deviate significantly from expected data, thus supporting or refuting the null hypothesis.
Types of Chi-Square Tests
The Chi-Square test is a statistical method used to examine the differences between categorical variables. There are two main types of Chi-Square tests:
- Chi-Square Test of Independence: This test determines whether there is a significant association between two categorical variables. It assesses whether the observed frequencies in a contingency table differ from the expected frequencies.
- Chi-Square Goodness-of-Fit Test: This test evaluates whether a sample data matches a population with a specific distribution. It compares the observed frequency distribution of data with an expected frequency distribution.
Chi-Square Test of Independence
The Chi-Square Test of Independence is used when you want to determine if there is a significant association between two categorical variables. This test follows these steps:
- Define the null and alternative hypotheses.
- Create a contingency table for the two variables.
- Calculate the expected frequencies for each cell in the table.
- Compute the Chi-Square statistic using the formula: \[ \chi^2 = \sum \frac{(O - E)^2}{E} \] where \(O\) is the observed frequency and \(E\) is the expected frequency.
- Compare the calculated Chi-Square statistic with the critical value from the Chi-Square distribution table.
- Draw a conclusion based on the comparison.
Chi-Square Goodness-of-Fit Test
The Chi-Square Goodness-of-Fit Test is used to determine if a sample matches an expected distribution. This test follows these steps:
- Define the null and alternative hypotheses.
- Calculate the expected frequencies for each category based on the hypothesized distribution.
- Compute the Chi-Square statistic using the same formula: \[ \chi^2 = \sum \frac{(O - E)^2}{E} \] where \(O\) is the observed frequency and \(E\) is the expected frequency.
- Compare the calculated Chi-Square statistic with the critical value from the Chi-Square distribution table.
- Draw a conclusion based on the comparison.
By understanding and utilizing these two types of Chi-Square tests, researchers can effectively analyze categorical data and draw meaningful conclusions.
When to Use a Chi-Square Test?
The Chi-Square Test is a statistical method used to determine if there is a significant association between two categorical variables. It is especially useful when you have data in the form of counts or frequencies and want to understand the relationship between different categories.
Here are the key scenarios when you should use a Chi-Square Test:
- Testing Independence: Use the Chi-Square Test of Independence when you want to know if two categorical variables are independent or associated. For example, you might want to know if gender is associated with political party preference.
- Goodness of Fit: Use the Chi-Square Goodness of Fit Test when you want to see if a sample matches an expected distribution. For instance, a shop owner might want to know if the number of customers entering the shop each day follows a uniform distribution.
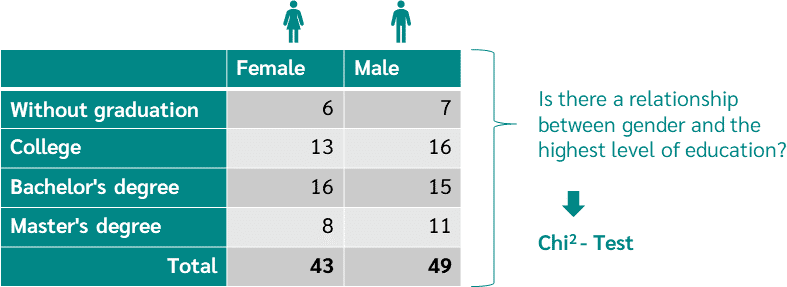
- Analyzing Survey Data: Researchers often use the Chi-Square Test to analyze survey data to see if there are relationships between different survey responses, such as the relationship between education level and marital status.
To use the Chi-Square Test effectively, ensure that your data meets these criteria:
- The data should be from a random sample.
- The variables under consideration should be categorical.
- The expected frequency count for each cell in the contingency table should be at least 5.
The Chi-Square Test provides a valuable way to determine whether observed data differs significantly from expected data under a specific hypothesis. It is widely used in various fields, including market research, political science, and biology, to make informed decisions based on categorical data.

Steps to Perform a Chi-Square Test
- Define the null hypothesis \( H_0 \) and alternative hypothesis \( H_a \).
- Gather categorical data and organize it into a contingency table.
- Calculate expected frequencies for each cell in the contingency table under the assumption that the null hypothesis is true.
- Compute the chi-square (\( \chi^2 \)) statistic using the formula:
\( \chi^2 = \sum \frac{(O_i - E_i)^2}{E_i} \)
Where \( O_i \) is the observed frequency and \( E_i \) is the expected frequency for each cell. - Determine the degrees of freedom (df). For a chi-square test of independence with \( r \) rows and \( c \) columns, \( df = (r-1)(c-1) \).
- Find the critical value of chi-square for the chosen significance level \( \alpha \) and degrees of freedom \( df \) using chi-square distribution tables or statistical software.
- Compare the computed chi-square statistic with the critical value:
- If \( \chi^2 \) > Critical value, reject \( H_0 \); there is evidence that the variables are associated (independence test) or the data does not fit the expected distribution (goodness-of-fit test).
- If \( \chi^2 \) ≤ Critical value, fail to reject \( H_0 \); there is no significant evidence against the null hypothesis.
- Interpret the results in the context of the specific chi-square test performed, considering the calculated \( \chi^2 \) statistic, degrees of freedom, and significance level.
Example of Chi-Square Test of Independence
Suppose we want to determine if there is an association between gender and smoking habits among a sample of 200 individuals.
| Non-Smoker | Occasional Smoker | Regular Smoker | |
|---|---|---|---|
| Male | 50 | 30 | 20 |
| Female | 60 | 25 | 15 |
In this example:
- Null Hypothesis (\( H_0 \)): There is no association between gender and smoking habits.
- Alternative Hypothesis (\( H_a \)): There is an association between gender and smoking habits.
Steps to perform the chi-square test of independence:
- Organize data into a contingency table with rows representing gender and columns representing smoking habits.
- Calculate expected frequencies assuming independence.
- Compute the chi-square (\( \chi^2 \)) statistic.
- Determine degrees of freedom (df = (rows - 1) * (columns - 1)).
- Compare \( \chi^2 \) with critical value at a chosen significance level (e.g., \( \alpha = 0.05 \)).
- Interpret the result: if \( \chi^2 \) > Critical value, reject \( H_0 \) and conclude there is an association; if \( \chi^2 \) ≤ Critical value, fail to reject \( H_0 \).
Example of Chi-Square Goodness-of-Fit Test
An example of the chi-square goodness-of-fit test involves testing whether the observed frequencies of a categorical variable match a hypothesized distribution.
| Category | Observed Frequency | Expected Frequency |
|---|---|---|
| Category A | 45 | 40 |
| Category B | 30 | 35 |
| Category C | 25 | 25 |
In this example:
- Null Hypothesis (\( H_0 \)): The observed frequencies fit the expected frequencies.
- Alternative Hypothesis (\( H_a \)): The observed frequencies do not fit the expected frequencies.
Steps to perform the chi-square goodness-of-fit test:
- Specify the null and alternative hypotheses.
- Organize observed and expected frequencies into a table.
- Calculate the chi-square (\( \chi^2 \)) statistic using the formula:
- Determine degrees of freedom (df = number of categories - 1).
- Find the critical value of chi-square for the chosen significance level (e.g., \( \alpha = 0.05 \)).
- Compare \( \chi^2 \) with the critical value:
- If \( \chi^2 \) > Critical value, reject \( H_0 \) and conclude that observed frequencies do not fit expected frequencies.
- If \( \chi^2 \) ≤ Critical value, fail to reject \( H_0 \) and conclude that observed frequencies fit expected frequencies.
\( \chi^2 = \sum \frac{(O_i - E_i)^2}{E_i} \)
Applications of Chi-Square Test
The chi-square test is widely used in various fields to analyze categorical data and determine if there is a significant association between variables or if observed data fit expected distributions.
- Medical Research: Assessing whether a treatment has an effect on patient outcomes based on categorical response data.
- Social Sciences: Studying the relationship between demographic variables such as age, gender, and voting preferences.
- Market Research: Analyzing consumer preferences across different product categories.
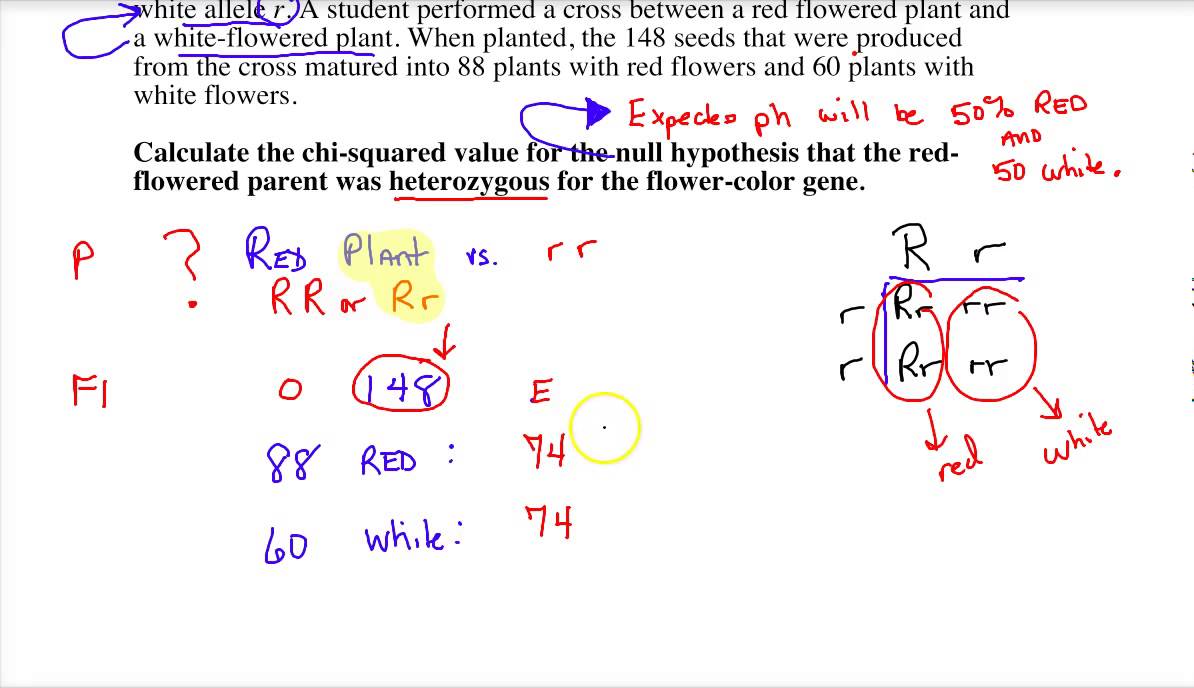
- Biology: Testing genetic ratios and determining whether observed ratios of offspring match expected ratios.
- Quality Control: Verifying whether the distribution of defective products across different categories meets expected standards.
- Epidemiology: Investigating the association between exposure to risk factors and the development of diseases.
Common Mistakes and Assumptions
While performing chi-square tests, certain mistakes and assumptions should be avoided to ensure accurate interpretation of results:
- Small Sample Size: Using chi-square tests with small sample sizes can lead to unreliable results, as the test may not have enough power to detect associations.
- Cell or Category Requirements: Each cell in a contingency table should ideally have an expected frequency of at least 5 for the chi-square test to be valid. Violating this assumption can lead to inaccurate conclusions.
- Independence Assumption: Chi-square tests assume that observations are independent. If data is correlated or comes from paired samples, chi-square tests may not be appropriate.
- Appropriate Test Selection: Using chi-square tests for data that do not fit the categorical nature or the assumptions of the test can lead to misleading results.
- Interpreting Statistical Significance: Statistical significance does not imply practical significance. A significant chi-square result indicates an association but does not explain the strength or direction of the relationship.
- Multiple Comparisons: Conducting multiple chi-square tests on the same data without adjusting for multiple comparisons can inflate the Type I error rate.
Conclusion
The chi-square test is a valuable statistical tool for analyzing categorical data and determining whether observed frequencies differ significantly from expected frequencies. It is widely applicable across various fields such as medical research, social sciences, market research, biology, quality control, and epidemiology.
By following proper procedures and avoiding common mistakes such as small sample sizes, violating cell requirements, and misinterpreting statistical significance, researchers can effectively use chi-square tests to draw meaningful conclusions about associations and distributions within their data.
Understanding the assumptions and limitations of the chi-square test is crucial for its accurate application. When used appropriately, the chi-square test provides valuable insights into categorical relationships and distributions, contributing to evidence-based decision-making in research and practice.
Frequently Asked Questions (FAQs)
- When should I use the Chi-Square Test?
The chi-square test is used when you have categorical data and want to determine if there is a significant association between variables or if observed data fit expected distributions.
- Can the Chi-Square Test be used for continuous variables?
No, the chi-square test is specifically designed for categorical data. For continuous variables, other statistical tests like t-tests or ANOVA are more appropriate.
- What software can I use to conduct a Chi-Square Test?
Popular statistical software packages such as SPSS, R, SAS, and Excel have functions or procedures to perform chi-square tests.
- How do I interpret the Chi-Square Test results?
If the computed chi-square statistic is greater than the critical value at a chosen significance level (e.g., \( \alpha = 0.05 \)), it suggests that there is a significant association or the data do not fit the expected distribution. If it is less than the critical value, there is no significant evidence against the null hypothesis.
- Are there alternatives to the Chi-Square Test for categorical data?
Yes, alternatives include Fisher's exact test, G-test, and likelihood ratio tests, which may be more suitable depending on the specific characteristics of the data and the research question.
Xem video này để hiểu rõ hơn về Kiểm Định Chi Bình Phương và cách áp dụng nó trong các ví dụ cụ thể.
Video về Kiểm Định Chi Bình Phương
READ MORE:
Xem video này để biết cách thực hiện Kiểm Định Chi Bình Phương bằng tay và áp dụng nó trong các ví dụ cụ thể.
Cách Thực Hiện Kiểm Định Chi Bình Phương Bằng Tay