Topic chi square test example with solution: Explore the comprehensive guide to understanding the chi-square test with practical examples and detailed solutions. Learn how to perform this statistical test step-by-step and interpret the results accurately. This article covers different types of chi-square tests, their applications, and limitations, making it an essential resource for students and professionals alike.
Table of Content
- Chi-Square Test Example with Solution
- Introduction to Chi-Square Test
- Types of Chi-Square Tests
- Chi-Square Test Formula
- Steps to Perform Chi-Square Test
- Examples of Chi-Square Test
- Interpreting Chi-Square Test Results
- Common Applications of Chi-Square Test
- Limitations of Chi-Square Test
- Additional Resources
- YOUTUBE: Tìm hiểu về kiểm định Chi-Square thông qua ví dụ và lời giải chi tiết. Hãy cùng khám phá cách áp dụng kiểm định này trong thực tế để hiểu rõ hơn về nó.
Chi-Square Test Example with Solution
The chi-square test is a statistical method to determine if there is a significant association between two categorical variables. This guide will walk you through an example of a chi-square test of independence with a detailed solution.
Example: Testing Independence of Gender and Education Level
We want to test if gender and education level are independent at a 5% level of significance. We surveyed 395 people and recorded their highest education level and gender. The observed frequencies are:
| High School | Bachelors | Masters | Ph.D. | Total | |
| Female | 60 | 54 | 46 | 41 | 201 |
| Male | 40 | 44 | 53 | 57 | 194 |
| Total | 100 | 98 | 99 | 98 | 395 |
Calculating Expected Frequencies
The expected frequency for each cell is calculated using the formula:
\[
E_{ij} = \frac{(Row\, Total \times Column\, Total)}{Grand\, Total}
\]
For example, the expected frequency for females with a high school education is:
\[
E_{11} = \frac{(201 \times 100)}{395} = 50.886
\]
The complete table of expected frequencies is:
| High School | Bachelors | Masters | Ph.D. | Total | |
| Female | 50.886 | 49.868 | 50.377 | 49.868 | 201 |
| Male | 49.114 | 48.132 | 48.623 | 48.132 | 194 |
| Total | 100 | 98 | 99 | 98 | 395 |
Calculating the Chi-Square Statistic
The chi-square statistic is calculated using the formula:
\[
\chi^2 = \sum \frac{(O_{ij} - E_{ij})^2}{E_{ij}}
\]
Using the observed and expected frequencies, we get:
\[
\chi^2 = \frac{(60-50.886)^2}{50.886} + \frac{(54-49.868)^2}{49.868} + \cdots + \frac{(57-48.132)^2}{48.132} = 8.006
\]
Finding the Critical Value
The degrees of freedom (df) for this test is calculated as:
\[
df = (rows - 1) \times (columns - 1) = (2-1) \times (4-1) = 3
\]
The critical value of \(\chi^2\) at 5% significance level with 3 degrees of freedom is 7.815.
Conclusion
Since the calculated \(\chi^2\) value (8.006) is greater than the critical value (7.815), we reject the null hypothesis. This indicates that there is a significant relationship between gender and education level at the 5% significance level.

READ MORE:
Introduction to Chi-Square Test
The chi-square test, symbolically represented as \( \chi^2 \), is a statistical method used to determine whether there is a significant difference between the expected and observed frequencies in categorical data. Developed by Karl Pearson in 1900, it is commonly used in hypothesis testing to compare the distribution of categorical variables.
Chi-square tests are particularly useful in scenarios where researchers want to understand if there is an association between two categorical variables. The test evaluates the independence of these variables by comparing observed data against expected data, which is calculated based on the assumption that the null hypothesis is true.
Types of Chi-Square Tests
- Chi-Square Goodness of Fit Test: Used to determine if a single categorical variable follows a specific distribution.
- Chi-Square Test of Independence: Used to determine if there is a significant association between two categorical variables in a contingency table.
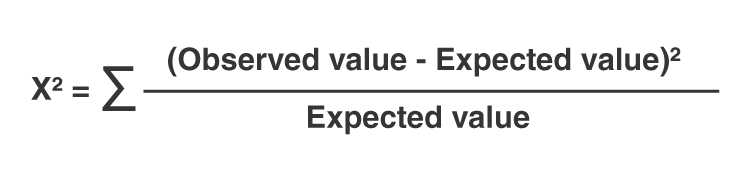
Formula for Chi-Square Test
The formula for the chi-square test statistic is:
\[ \chi^2 = \sum \frac{(O - E)^2}{E} \]
Where:
- \( O \) is the observed frequency.
- \( E \) is the expected frequency, calculated as: \[ E = \frac{\text{row total} \times \text{column total}}{\text{sample size}} \]
Steps to Perform a Chi-Square Test
- Define the null hypothesis (\( H_0 \)) and the alternative hypothesis (\( H_A \)).
- Null Hypothesis: Assumes no association between the variables.
- Alternative Hypothesis: Assumes an association between the variables.
- Calculate the expected frequencies for each category in the contingency table.
- Compute the chi-square test statistic using the formula.
- Determine the degrees of freedom, which is calculated as: \[ \text{Degrees of Freedom} = (r - 1) \times (c - 1) \] where \( r \) is the number of rows and \( c \) is the number of columns.
- Compare the test statistic to the critical value from the chi-square distribution table. If the test statistic is greater than the critical value, reject the null hypothesis.
Example
Consider a study examining whether gender is independent of education level. A sample of 395 people provides the following data:
| Gender | High School | Bachelor's | Master's | Ph.D. | Total |
|---|---|---|---|---|---|
| Female | 60 | 54 | 46 | 41 | 201 |
| Male | 40 | 44 | 53 | 57 | 194 |
| Total | 100 | 98 | 99 | 98 | 395 |
By calculating the expected frequencies and the chi-square statistic, researchers can determine if there is a significant association between gender and education level.
Types of Chi-Square Tests
The Chi-Square test is a statistical method used to determine if there is a significant association between categorical variables. There are three main types of Chi-Square tests, each serving a specific purpose:
- Chi-Square Test of Independence:
This test is used to determine if there is a significant association between two categorical variables. For example, it can be used to assess if gender is related to voting preferences. The test compares the observed frequencies in each category to the frequencies that would be expected if there was no association between the variables.
The formula for the test statistic is:
\[ X^2 = \sum \frac{(O_i - E_i)^2}{E_i} \]
where \( O_i \) is the observed frequency and \( E_i \) is the expected frequency.
- Chi-Square Goodness of Fit Test:
This test is used to determine if a sample data matches a population with a specific distribution. For example, it can be used to test if a die is fair by comparing the observed frequencies of the die rolls to the expected frequencies if the die was fair.
The test checks how well the observed data fit the expected distribution. The formula for the test statistic is the same as for the test of independence:
\[ X^2 = \sum \frac{(O_i - E_i)^2}{E_i} \]
- Chi-Square Test of Homogeneity:
This test is used to determine if different populations have the same proportion of a categorical variable. For example, it can be used to test if the proportion of people who prefer different brands of a product is the same across different regions.
The steps involved include stating the hypotheses, formulating an analysis plan, analyzing sample data, and interpreting the results.
Chi-Square Test Formula
The Chi-Square test is a statistical method used to determine if there is a significant association between categorical variables. The test compares the observed frequencies in each category to the frequencies expected if there were no association between the variables. The formula for the Chi-Square test statistic is:
\[
\chi^2 = \sum \frac{(O - E)^2}{E}
\]
Where:
- O: Observed frequency
- E: Expected frequency under the null hypothesis
The expected frequency (E) can be calculated using the formula:
\[
E = \frac{(\text{row total}) \times (\text{column total})}{\text{grand total}}
\]
The degrees of freedom (df) for the test are calculated as:
\[
df = (r - 1) \times (c - 1)
\]
Where r is the number of rows and c is the number of columns in the contingency table.
After calculating the Chi-Square statistic, compare it to the critical value from the Chi-Square distribution table. If the Chi-Square statistic is greater than the critical value, the null hypothesis of no association between the variables is rejected.
| Step | Action |
|---|---|
| 1 | Calculate the expected frequencies for each category. |
| 2 | Use the formula \(\chi^2 = \sum \frac{(O - E)^2}{E}\) to calculate the Chi-Square statistic. |
| 3 | Determine the degrees of freedom (df). |
| 4 | Compare the Chi-Square statistic to the critical value from the Chi-Square distribution table. |
| 5 | If the Chi-Square statistic is greater than the critical value, reject the null hypothesis. |
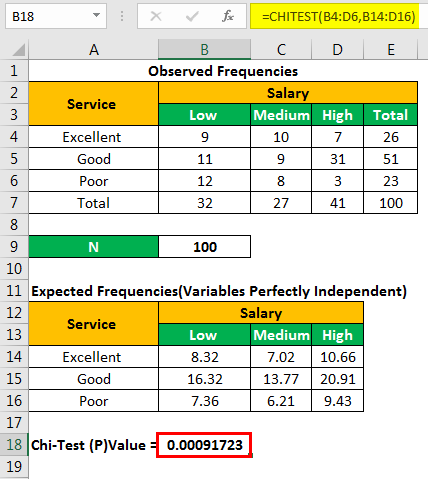
Example:
Consider a study to determine if there is an association between gender (male, female) and preference for a new product (like, dislike). The observed frequencies are recorded in a contingency table, and the expected frequencies are calculated. Using the Chi-Square formula, the test statistic is computed and compared to the critical value to determine if there is a significant association.
Steps to Perform Chi-Square Test
The Chi-Square test is a statistical method to determine if there's a significant association between categorical variables. Follow these steps to perform a Chi-Square test:
-
Formulate the Hypotheses:
- Null Hypothesis (H0): Assumes no association between the variables (they are independent).
- Alternative Hypothesis (H1): Assumes there is an association between the variables (they are dependent).
-
Prepare the Data:
Create a contingency table to summarize the frequency of occurrences for the categories of each variable.
-
Calculate Expected Frequencies:
Use the formula:
\[ E = \dfrac{(\text{Row Total} \times \text{Column Total})}{\text{Grand Total}} \]
to calculate the expected frequency for each cell in the contingency table.
-
Compute the Chi-Square Statistic:
Apply the formula:
\[ \chi^2 = \sum \dfrac{(O - E)^2}{E} \]
where \(O\) is the observed frequency and \(E\) is the expected frequency. Sum the values for all cells.
-
Determine the Degrees of Freedom (df):
Calculate the degrees of freedom using:
\[ df = (r - 1) \times (c - 1) \]
where \(r\) is the number of rows and \(c\) is the number of columns.
-
Find the Critical Value:
Refer to the Chi-Square distribution table using the calculated degrees of freedom and the desired significance level (typically 0.05).
-
Compare the Chi-Square Statistic to the Critical Value:
If the Chi-Square statistic is greater than the critical value, reject the null hypothesis.
-
Interpret the Results:
- Reject H0: There is a significant association between the variables.
- Fail to Reject H0: There is no significant association between the variables.
Examples of Chi-Square Test
Chi-square tests are used to examine the relationship between categorical variables. Below are examples illustrating the application of chi-square tests in various scenarios.
Example 1: Education Level and Gender
A survey of 395 people was conducted to determine if education level is independent of gender. The observed frequencies are:
| High School | Bachelors | Masters | Ph.D. | Total | |
|---|---|---|---|---|---|
| Female | 60 | 54 | 46 | 41 | 201 |
| Male | 40 | 44 | 53 | 57 | 194 |
| Total | 100 | 98 | 99 | 98 | 395 |
Expected frequencies are calculated based on the marginal totals. Using the chi-square formula:
\[
\chi^2 = \sum \frac{(O - E)^2}{E}
\]
We find the chi-square statistic and compare it with the critical value to determine significance. In this case, the chi-square statistic was 8.006 with a critical value of 7.815, leading to the rejection of the null hypothesis, suggesting a dependency between education level and gender.
Example 2: Dog Food Preference
A dog food company wants to test if three new flavors are equally popular among dogs. A sample of 75 dogs is tested, and the observed frequencies are:
| Flavor | Observed | Expected |
|---|---|---|
| Garlic Blast | 22 | 25 |
| Blueberry Delight | 30 | 25 |
| Minty Munch | 23 | 25 |
Applying the chi-square goodness of fit test:
\[
\chi^2 = \sum \frac{(O - E)^2}{E}
\]
The chi-square statistic helps determine if the observed distribution of choices differs significantly from what was expected. If the chi-square statistic exceeds the critical value, it indicates a significant preference for one or more flavors.
These examples demonstrate the versatility of chi-square tests in analyzing categorical data and determining the relationships or preferences within the data.
Interpreting Chi-Square Test Results
Interpreting the results of a Chi-Square test involves several key steps to understand the significance of the findings:
- Significance Levels: Determine the chosen significance level (often denoted as α, typically 0.05) to assess whether the observed results are statistically significant.
- P-Value Interpretation: Calculate the p-value associated with the Chi-Square statistic. The p-value indicates the probability of obtaining results as extreme as the observed results under the null hypothesis. If p < α, the null hypothesis is rejected in favor of the alternative hypothesis.
- Conclusion and Reporting: Based on the p-value and significance level, conclude whether there is sufficient evidence to reject the null hypothesis. Report the findings clearly, stating whether the variables are dependent (reject null) or independent (fail to reject null).
Common Applications of Chi-Square Test
- Survey Data Analysis: Chi-Square tests are widely used to analyze survey data, especially categorical data such as preferences, opinions, or behaviors across different groups.
- Market Research: In market research, Chi-Square tests help in examining relationships between demographic variables and consumer preferences or buying behaviors.
- Social Science Studies: Chi-Square tests are applied in social sciences to explore relationships between variables such as gender, age, or education level and various social phenomena or attitudes.
Limitations of Chi-Square Test
- Assumptions and Conditions: Chi-Square tests assume that the data are categorical, the observations are independent, and that the expected frequencies are sufficiently large. Violation of these assumptions can lead to inaccurate results.
- Common Pitfalls: Chi-Square tests may not be appropriate for small sample sizes or when expected cell frequencies are too low. In such cases, alternative tests or adjustments may be necessary.

Additional Resources
- Statistical Software for Chi-Square Test: Explore popular statistical software packages such as SPSS, R, and SAS, which offer tools for conducting Chi-Square tests and analyzing categorical data.
- Further Reading and Tutorials: Access online tutorials, guides, and academic resources that provide in-depth explanations and examples of Chi-Square tests, enhancing understanding and application.
Tìm hiểu về kiểm định Chi-Square thông qua ví dụ và lời giải chi tiết. Hãy cùng khám phá cách áp dụng kiểm định này trong thực tế để hiểu rõ hơn về nó.
Kiểm định Chi-Square
READ MORE:
Hướng dẫn chi tiết cách thực hiện kiểm định Chi-Square bằng tay. Khám phá cách áp dụng kiểm định này với ví dụ cụ thể và lời giải chi tiết.
Cách thực hiện kiểm định Chi-Square (bằng tay)


:max_bytes(150000):strip_icc()/Chi-SquareStatistic_Final_4199464-7eebcd71a4bf4d9ca1a88d278845e674.jpg)