Topic chi-square test of independence example problems with answers pdf: Explore comprehensive examples of Chi-Square Test of Independence with detailed solutions in PDF format. Master the application of this statistical method through step-by-step problem-solving and gain insights into interpreting results effectively. Perfect resource for understanding assumptions, limitations, and real-world applications. Simplify your learning with clear, practical examples and answers.
Table of Content
- Chi-Square Test of Independence Example Problems with Answers
- Table of Contents
- Introduction to Chi-Square Test of Independence
- Example 1: Chi-Square Test of Independence Problem Statement
- Example 1 Solution: Step-by-step Calculation
- Interpreting Chi-Square Test Results
- Example 2: Application of Chi-Square Test in Real-world Data
- Chi-Square Test Assumptions and Limitations
- Common Mistakes in Chi-Square Test Interpretation
- Chi-Square Test of Independence: FAQs
- Conclusion
- YOUTUBE:
Chi-Square Test of Independence Example Problems with Answers
The Chi-Square test of independence is a statistical method used to determine if there is a significant association between two categorical variables. Below are example problems along with detailed solutions to help you understand and apply this test.
Example 1: Recycling Behavior Study
Suppose a city wants to determine if recycling behavior is independent of the type of intervention used. They conduct an experiment with three groups: flyer, phone call, and control. The observed frequencies are shown in the table below:
| Recycles | Does not recycle | |
| Flyer | 89 | 9 |
| Phone call | 84 | 8 |
| Control | 86 | 24 |
Step-by-Step Solution
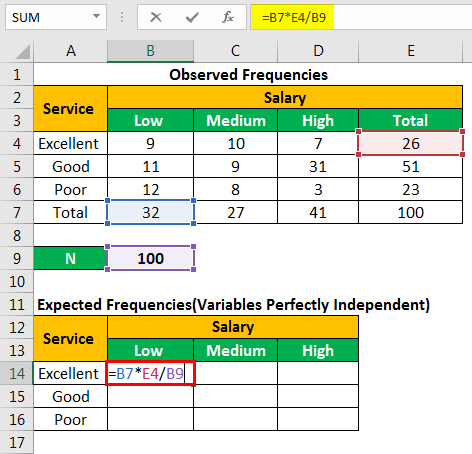
- Calculate the expected frequencies:
Use the formula \( E = \dfrac{(\text{Row total} \times \text{Column total})}{\text{Grand total}} \).
- Expected frequency for Flyer-Recycles: \( E = \dfrac{(98 \times 259)}{300} = 84.61 \)
- Expected frequency for Flyer-Does not recycle: \( E = \dfrac{(98 \times 41)}{300} = 13.39 \)
- Repeat for all cells.
- Calculate the chi-square statistic:
Use the formula \( \chi^2 = \sum \dfrac{(O - E)^2}{E} \).
- \( \chi^2_{Flyer-Recycles} = \dfrac{(89 - 84.61)^2}{84.61} = 0.23 \)
- \( \chi^2_{Flyer-Does not recycle} = \dfrac{(9 - 13.39)^2}{13.39} = 1.44 \)
- Sum all chi-square values: \( \chi^2 = 0.23 + 1.44 + 0.26 + 1.66 + 0.85 + 5.35 = 9.79 \)
- Find the critical value:
For \( df = (rows-1)(columns-1) = (3-1)(2-1) = 2 \) at \( \alpha = 0.05 \), the critical value is 5.99.
- Compare the chi-square value to the critical value:
Since \( \chi^2 = 9.79 \) is greater than 5.99, we reject the null hypothesis.
- Conclusion:
There is a significant association between recycling behavior and the type of intervention.
Example 2: Political Party Preference
A survey of 500 voters aims to determine if political party preference is independent of gender. The observed frequencies are:
| Republican | Democrat | Independent | Total | |
| Male | 120 | 90 | 40 | 250 |
| Female | 110 | 95 | 45 | 250 |
| Total | 230 | 185 | 85 | 500 |
Step-by-Step Solution
- Define the hypotheses:
- Null hypothesis: \( H_0 \): Gender and political party preference are independent.
- Alternative hypothesis: \( H_1 \): Gender and political party preference are not independent.
- Calculate the expected frequencies:
- Expected frequency for Male Republicans: \( E = \dfrac{(250 \times 230)}{500} = 115 \)
- Calculate the chi-square statistic:
Using \( \chi^2 = \sum \dfrac{(O - E)^2}{E} \).
- \( \chi^2_{Male-Republican} = \dfrac{(120 - 115)^2}{115} = 0.2174 \)
- Sum all chi-square values: \( \chi^2 = 0.8642 \)
- Find the p-value:
For \( df = (2-1)(3-1) = 2 \), the p-value is 0.649.
- Conclusion:
Since the p-value is not less than 0.05, we fail to reject the null hypothesis. There is no significant association between gender and political party preference.

READ MORE:
Table of Contents
- Introduction to Chi-Square Test of Independence
- Overview of Example Problems with Answers
-
Example 1: Chi-Square Test of Independence Problem Statement
- Variables and Hypotheses
- Data Collection and Setup
-
Example 1 Solution: Step-by-step Calculation
- Expected Frequencies Calculation
- Chi-Square Statistic Calculation
- Critical Value Determination
- Conclusion and Interpretation
- Interpreting Chi-Square Test Results
-
Example 2: Application of Chi-Square Test in Real-world Data
- Data Description and Setup
- Calculation of Chi-Square Test Statistic
- Interpretation of Findings
- Common Mistakes in Chi-Square Test Interpretation
- Chi-Square Test of Independence: FAQs
- Conclusion
Introduction to Chi-Square Test of Independence
The Chi-Square Test of Independence is a statistical method used to determine whether there is a significant association between categorical variables. It assesses whether the observed frequencies of variables are significantly different from the expected frequencies, assuming the variables are independent. This test is widely applied in research across various fields including social sciences, biology, and business analytics. Understanding its principles is crucial for drawing meaningful conclusions from categorical data.
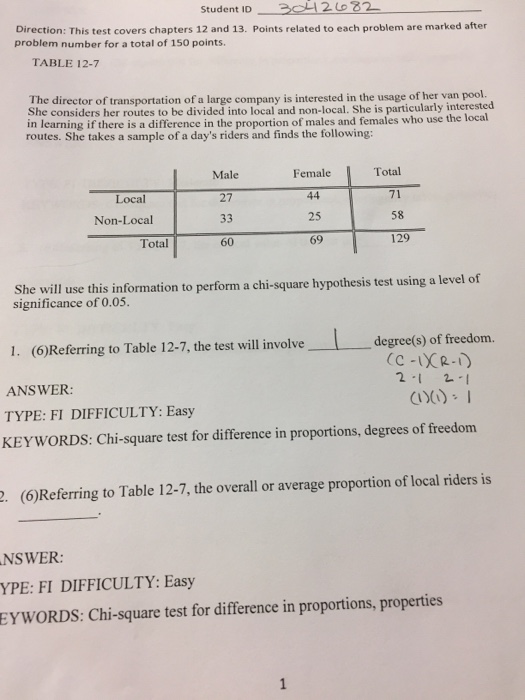
Example 1: Chi-Square Test of Independence Problem Statement
Consider a study investigating the relationship between gender and voting preferences among 500 individuals. The null hypothesis states that gender and voting preferences are independent. The alternative hypothesis suggests there is an association between gender and voting preferences. Data collected includes the number of males and females who prefer different political parties. The Chi-Square Test of Independence will determine if there is significant evidence to reject the null hypothesis.
Example 1 Solution: Step-by-step Calculation
- Calculate the expected frequencies for each cell in the contingency table based on the null hypothesis of independence.
- Construct the observed contingency table using the given data of males and females with their respective voting preferences.
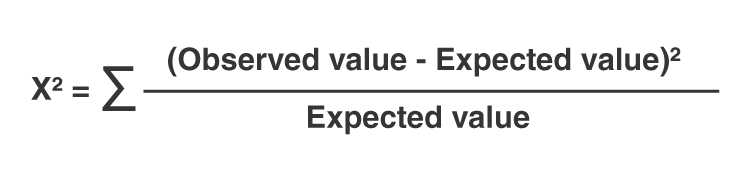
- Compute the Chi-Square test statistic using the formula: \( \chi^2 = \sum \frac{(O_i - E_i)^2}{E_i} \), where \( O_i \) is the observed frequency and \( E_i \) is the expected frequency.
- Determine the degrees of freedom (df) for the Chi-Square distribution, which is calculated as \( df = (rows - 1) \times (columns - 1) \).
- Find the critical value of Chi-Square for a given significance level (e.g., 0.05) and degrees of freedom.
- Compare the calculated Chi-Square statistic with the critical value.
- Draw a conclusion based on the comparison: reject the null hypothesis if the calculated Chi-Square statistic exceeds the critical value, indicating a significant association between gender and voting preferences.
Interpreting Chi-Square Test Results
Once you have performed a Chi-Square Test of Independence, interpreting the results involves several key steps:
- Review the calculated Chi-Square statistic from your analysis.
- Consult the Chi-Square distribution table to find the critical value corresponding to your chosen significance level (e.g., 0.05).
- Compare the calculated Chi-Square statistic with the critical value:
- If the calculated Chi-Square statistic is greater than the critical value, you can reject the null hypothesis.
- Conversely, if the calculated Chi-Square statistic is less than or equal to the critical value, you fail to reject the null hypothesis.
- Consider the degrees of freedom (df) used in the Chi-Square test, as it impacts the critical value.
- Report the p-value associated with the Chi-Square statistic, which indicates the probability of observing such a result by chance under the null hypothesis.
- Interpret the p-value:
- A low p-value (typically < 0.05) suggests strong evidence against the null hypothesis.
- A high p-value suggests weak evidence against the null hypothesis, meaning the data does not provide significant evidence to reject it.
- Summarize the findings and discuss the implications of the Chi-Square test results in relation to your research question.
Example 2: Application of Chi-Square Test in Real-world Data
Explore a practical application of the Chi-Square Test of Independence using real-world data:
- Data Description and Setup: Collect categorical data that involves two or more groups or categories.
- Formulate Hypotheses: Define the null hypothesis stating there is no association between the variables, and the alternative hypothesis suggesting otherwise.
- Construct Contingency Table: Organize the data into a contingency table where rows represent one categorical variable and columns represent another.
- Calculate Expected Frequencies: Compute the expected frequencies for each cell assuming the variables are independent.
- Perform Chi-Square Test: Apply the Chi-Square Test formula to determine the test statistic.
- Interpret Findings: Compare the calculated Chi-Square statistic with the critical value and interpret the p-value to draw conclusions about the association between variables.
- Discuss Results: Summarize the implications of the findings and discuss how they contribute to understanding the relationship between the variables studied.
Chi-Square Test Assumptions and Limitations
Understanding the assumptions and limitations of the Chi-Square Test of Independence is essential for accurate interpretation:
- Independence: The observations are assumed to be independent of each other.
- Sample Size: Each expected frequency should ideally be 5 or more to ensure the validity of the Chi-Square approximation.
- Categorical Data: The data must be categorical and fit into a contingency table format.
- Expected Frequencies: The expected frequencies should be reasonably large to apply the Chi-Square approximation.
- Limitations: Chi-Square Test does not indicate the strength or direction of the association between variables, only its presence.
- Assumption of Large Sample: For small sample sizes, exact tests or alternative methods may be more appropriate.
- Interpretation Caution: Significant results do not imply causation but rather indicate a significant association between variables.
Common Mistakes in Chi-Square Test Interpretation
Understanding common mistakes in the interpretation of Chi-Square Test results is crucial for accurate analysis. Below are some common pitfalls and how to avoid them:
- Misinterpreting the p-value:
The p-value indicates the probability of observing the data, or something more extreme, if the null hypothesis is true. A common mistake is to interpret a high p-value as evidence for the null hypothesis, rather than simply a lack of evidence against it.
- Ignoring Assumptions:
The Chi-Square Test assumes that the data is categorical and that the expected frequency for each cell is at least 5. Failing to meet these assumptions can lead to inaccurate results.
- Incorrect Degrees of Freedom:
The degrees of freedom for a Chi-Square Test of Independence are calculated as (number of rows - 1) * (number of columns - 1). Using incorrect degrees of freedom will affect the critical value and the conclusion of the test.
- Overlooking Effect Size:
Even if a Chi-Square test shows statistical significance, the effect size (e.g., Cramér's V) should be considered to understand the strength of the association.
- Multiple Comparisons Problem:
Conducting multiple Chi-Square tests on the same dataset increases the risk of Type I errors. Adjustments, such as the Bonferroni correction, should be applied.
- Misinterpretation of Independence:
Failing to reject the null hypothesis does not prove that the variables are independent; it simply suggests that there is not enough evidence to conclude they are associated.
To correctly interpret the Chi-Square Test results, it is essential to understand these common mistakes and ensure that the assumptions and conditions of the test are met.
Chi-Square Test of Independence: FAQs
Below are some frequently asked questions about the Chi-Square Test of Independence along with detailed answers:
-
What is the Chi-Square Test of Independence?
The Chi-Square Test of Independence is a statistical test used to determine whether there is a significant association between two categorical variables. It compares the observed frequencies in each category of a contingency table to the frequencies we would expect if the variables were independent.
-
How do I calculate the Chi-Square statistic?
The Chi-Square statistic (Χ2) is calculated using the formula:
X^2 = \sum \frac{(O - E)^2}{E}
Where \(O\) represents the observed frequency and \(E\) represents the expected frequency. The sum is taken over all categories.
-
What are the hypotheses for the Chi-Square Test of Independence?
The null hypothesis (H0) states that there is no association between the two variables; they are independent. The alternative hypothesis (H1) states that there is an association between the variables; they are not independent.
-
How do I calculate the expected frequencies?
The expected frequency for each cell in a contingency table is calculated using the formula:
E = \frac{(\text{row total} \times \text{column total})}{\text{grand total}}
-
How do I determine the degrees of freedom for the Chi-Square Test?
The degrees of freedom (df) for the Chi-Square Test of Independence is calculated as:
df = (r - 1) \times (c - 1)
Where \(r\) is the number of rows and \(c\) is the number of columns in the contingency table.
-
What is the significance level and how do I use it in the Chi-Square Test?
The significance level (α) is the probability threshold below which the null hypothesis is rejected. Commonly used significance levels are 0.05, 0.01, and 0.10. Compare the p-value from the Chi-Square statistic to α to determine if the result is statistically significant.
-
What are common pitfalls when interpreting Chi-Square Test results?
Common mistakes include interpreting the Chi-Square test without checking the assumptions (e.g., expected frequencies should be at least 5 for most cells), not accounting for the sample size, and misunderstanding the p-value as the probability that the null hypothesis is true.
-
Can I use the Chi-Square Test for small sample sizes?
For small sample sizes, the Chi-Square Test may not be appropriate because the expected frequency in each cell may be too low. In such cases, Fisher's Exact Test is recommended.
-
What are the assumptions of the Chi-Square Test of Independence?
- The data should be in the form of frequencies or counts of cases.
- The sample data must be randomly selected.
- Each observation should be independent of others.
- The expected frequency for each cell of the table should be at least 5.
Conclusion
The Chi-Square Test of Independence is a robust statistical tool used to determine if there is a significant association between two categorical variables. Through the examples and detailed calculations provided, we have seen how to apply this test in various scenarios, from theoretical problems to real-world data.
Key takeaways include:
- Understanding the Hypotheses: The null hypothesis (\(H_0\)) posits that the variables are independent, while the alternative hypothesis (\(H_1\)) suggests an association between the variables.
- Calculating Expected Values: Expected values are calculated based on the marginal totals of the observed frequency table, using the formula: \[ E = \frac{(\text{row total}) \times (\text{column total})}{\text{grand total}} \]
- Computing the Test Statistic: The Chi-Square statistic (\(\chi^2\)) is computed by summing the squared differences between observed (\(O\)) and expected (\(E\)) values, divided by the expected values: \[ \chi^2 = \sum \frac{(O - E)^2}{E}
- Interpreting the Results: The p-value derived from the Chi-Square statistic and degrees of freedom determines whether we reject the null hypothesis. A p-value less than the chosen significance level (e.g., 0.05) indicates that the variables are not independent.
Through practical application, we also recognize the importance of ensuring that expected frequencies are sufficiently large (typically at least 5) to validate the use of the Chi-Square test. When this condition is not met, alternative tests like Fisher's Exact Test may be more appropriate.
In summary, the Chi-Square Test of Independence is invaluable in fields such as social sciences, medicine, and market research, where understanding the relationship between categorical variables can inform decision-making and hypothesis testing. By mastering this test, researchers can draw meaningful conclusions about their data, contributing to the advancement of knowledge in their respective fields.
Future research and applications will continue to benefit from this fundamental statistical test, making it an essential part of any analyst's toolkit.
Kiểm Định Chi-Square về Độc Lập
READ MORE:
Phần 3: Kiểm Định Chi-Square (χ2) | Câu Hỏi và Giải Đáp


:max_bytes(150000):strip_icc()/Chi-SquareStatistic_Final_4199464-7eebcd71a4bf4d9ca1a88d278845e674.jpg)