Topic examples of chi square test of independence: Understanding the Chi Square Test of Independence is crucial for analyzing categorical data. This test helps determine if there is a significant association between two categorical variables. In this article, we will explore various examples and applications of the Chi Square Test of Independence, making the concept easier to grasp for students, researchers, and data enthusiasts.
Table of Content
- Chi-Square Test of Independence
- Introduction to Chi-Square Test of Independence
- Understanding the Hypotheses
- Steps to Perform Chi-Square Test
- Examples of Chi-Square Test of Independence
- Conditions for Using Chi-Square Test
- Calculating Expected Values
- Calculating Chi-Square Test Statistic
- Interpreting the P-Value
- Software and Tools for Chi-Square Test
- YOUTUBE: Xem video về Phân tích kiểm định Chi-Square cho độc lập để hiểu cách thực hiện và diễn dịch kết quả một cách chi tiết.
Chi-Square Test of Independence
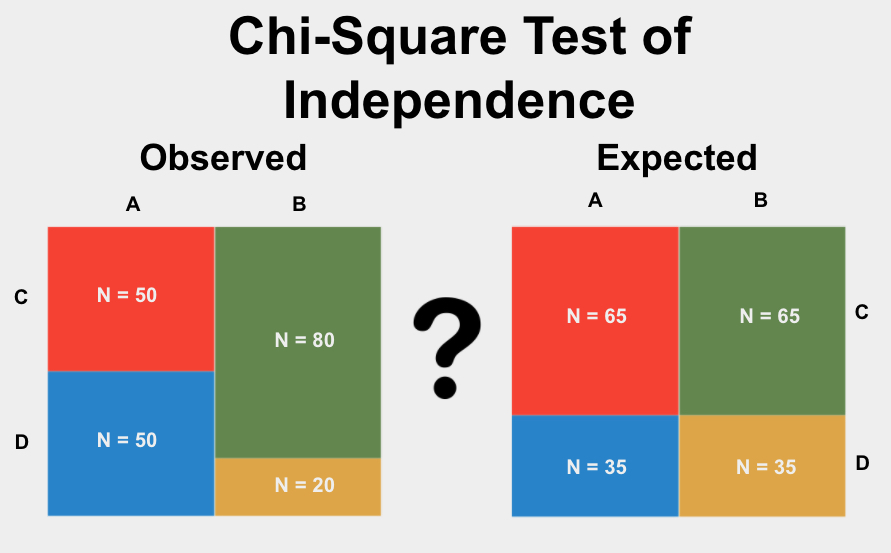
The Chi-Square Test of Independence is a statistical method used to determine if there is a significant association between two categorical variables. This test compares the observed frequencies of occurrence of the variables with the frequencies that would be expected if the variables were independent.
Hypotheses
The hypotheses for the Chi-Square Test of Independence are:
H_{0}: \text{The variables are independent} H_{1}: \text{The variables are not independent}
Steps to Perform the Test
- Define the hypotheses
For example, we want to determine if gender and political party preference are independent.
- Calculate the expected values
The expected value for each cell in a contingency table is calculated using:
\text{Expected value} = \frac{\text{(row sum) * (column sum)}}{\text{total sum}} For example, for Male Republicans:
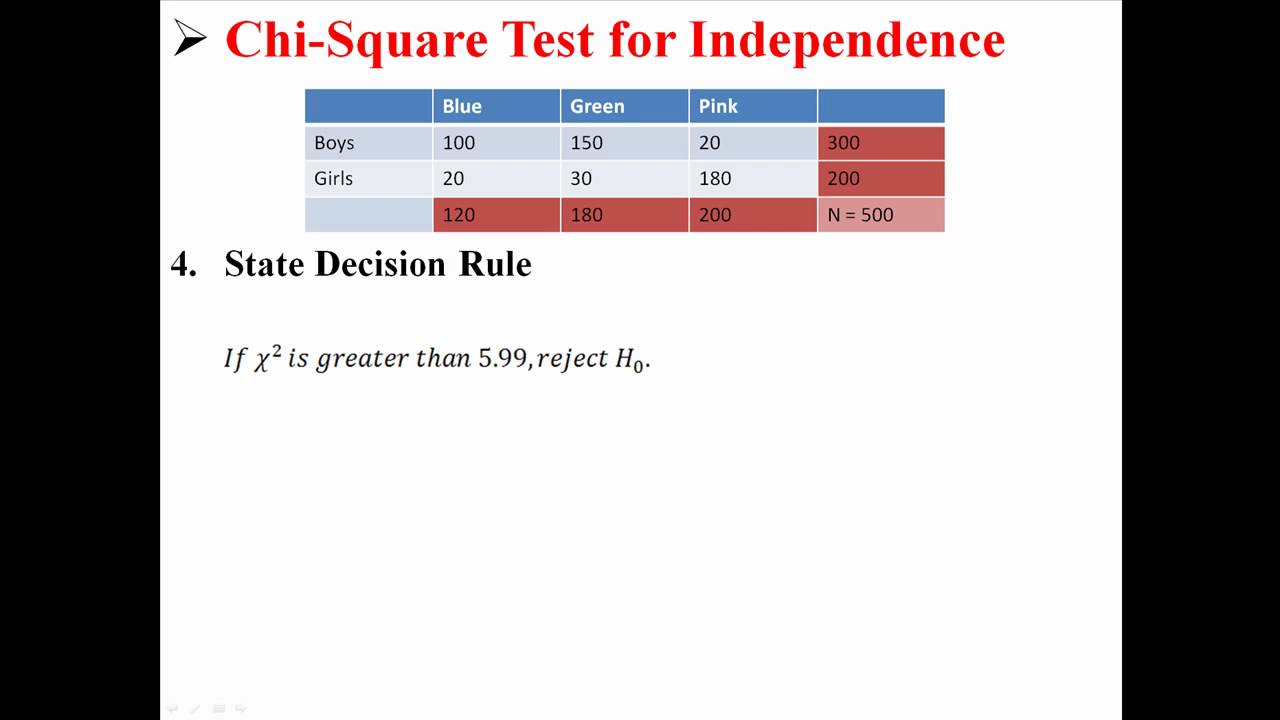
\frac{230 \times 250}{500} = 115 - Calculate
(O - E)^2 / E for each cell\frac{(120 - 115)^2}{115} = 0.2174 - Calculate the test statistic
\chi^2 and the p-valueThe test statistic is the sum of all
\frac{(O - E)^2}{E} values:\chi^2 = 0.2174 + 0.2174 + 0.0676 + 0.0676 + 0.1471 + 0.1471 = 0.8642 The p-value is determined from the chi-square distribution table based on the calculated
\chi^2 and degrees of freedom. - Draw a conclusion
Compare the p-value with the significance level (e.g., 0.05). If the p-value is less than the significance level, reject the null hypothesis.
Example
Consider the following contingency table:
| Republican | Democrat | Independent | Total | |
| Male | 120 | 90 | 40 | 250 |
| Female | 110 | 95 | 45 | 250 |
| Total | 230 | 185 | 85 | 500 |
Expected values calculation:
| Republican | Democrat | Independent | |
| Male | 115 | 92.5 | 42.5 |
| Female | 115 | 92.5 | 42.5 |
Calculation of
| Republican | Democrat | Independent | |
| Male | 0.2174 | 0.0676 | 0.1471 |
| Female | 0.2174 | 0.0676 | 0.1471 |
Test statistic:
Conclusion: Since the p-value is not less than 0.05, we fail to reject the null hypothesis. There is no significant association between gender and political party preference.
Conclusion
The Chi-Square Test of Independence is a powerful statistical tool for testing the association between two categorical variables. By following the steps outlined, one can determine if there is a significant relationship between the variables in question.

READ MORE:
Introduction to Chi-Square Test of Independence
The Chi-Square Test of Independence is a statistical method used to determine if there is a significant association between two categorical variables. This test is particularly useful in various fields such as social sciences, marketing, and medical research, where understanding the relationship between different categories can provide valuable insights.
To perform a Chi-Square Test of Independence, follow these steps:
- Define the Hypotheses:
- Null Hypothesis (H0): The two variables are independent.
- Alternative Hypothesis (H1): The two variables are not independent.
- Construct the Contingency Table: Organize the observed data into a table format where rows represent one categorical variable and columns represent the other.
- Calculate Expected Values: Use the formula:
\[ E = \frac{(\text{row total} \times \text{column total})}{\text{grand total}} \] This calculation is done for each cell in the contingency table. - Compute the Chi-Square Statistic: Use the formula:
\[ \chi^2 = \sum \frac{(O - E)^2}{E} \] where \( O \) is the observed frequency and \( E \) is the expected frequency. - Determine the Degrees of Freedom: Calculate the degrees of freedom using:
\[ \text{df} = (r - 1) \times (c - 1) \] where \( r \) is the number of rows and \( c \) is the number of columns. - Find the p-value: Compare the chi-square statistic to the critical value from the chi-square distribution table based on the calculated degrees of freedom and chosen significance level.
- Make a Decision: If the p-value is less than the significance level, reject the null hypothesis, indicating a significant association between the variables.
This method provides a systematic approach to testing the independence of two categorical variables, ensuring that the analysis is both thorough and accurate.
Understanding the Hypotheses
The Chi-Square Test of Independence is used to determine whether there is a significant association between two categorical variables. The hypotheses for this test are formulated as follows:
- Null Hypothesis (\(H_0\)): Assumes that there is no association between the two variables. In other words, the variables are independent.
- Alternative Hypothesis (\(H_1\)): Assumes that there is an association between the two variables. In other words, the variables are not independent.
To conduct the Chi-Square Test of Independence, follow these detailed steps:
-
State the Hypotheses: Formulate the null and alternative hypotheses. For example, if you are testing the relationship between gender (male, female) and political party preference (Republican, Democrat, Independent), the hypotheses would be:
- \(H_0\): Gender and political party preference are independent.
- \(H_1\): Gender and political party preference are not independent.
- Calculate Expected Values: Use the formula \[ \text{Expected value} = \frac{(\text{row sum} \times \text{column sum})}{\text{total sum}} \] For example, if the observed frequency for male Republicans is 120, the expected frequency is calculated as follows: \[ \text{Expected value} = \frac{(230 \times 250)}{500} = 115 \]
- Compute the Test Statistic: Use the formula \[ \chi^2 = \sum \frac{(O - E)^2}{E} \] where \(O\) is the observed frequency and \(E\) is the expected frequency. Calculate this for each cell in the contingency table. For example, for male Republicans: \[ \frac{(120 - 115)^2}{115} = 0.2174 \]
- Determine the Degrees of Freedom: Calculate the degrees of freedom using the formula: \[ df = (r - 1) \times (c - 1) \] where \(r\) is the number of rows and \(c\) is the number of columns. For a table with 2 rows and 3 columns: \[ df = (2 - 1) \times (3 - 1) = 2 \]
- Find the p-Value: Compare the calculated test statistic (\(\chi^2\)) with the critical value from the chi-square distribution table or use statistical software to find the p-value.
- Draw a Conclusion: If the p-value is less than the chosen significance level (e.g., 0.05), reject the null hypothesis. This indicates that there is a significant association between the variables. If the p-value is greater than the significance level, fail to reject the null hypothesis, indicating insufficient evidence to conclude an association.
This step-by-step approach ensures a thorough understanding of whether the categorical variables in your study are independent or associated.
Steps to Perform Chi-Square Test
The Chi-Square Test of Independence helps to determine if there is a significant association between two categorical variables. Here are the detailed steps to perform this test:
- Formulate the Hypotheses:
- Null Hypothesis (\( H_0 \)): The two variables are independent.
- Alternative Hypothesis (\( H_1 \)): The two variables are not independent.
- Construct a Contingency Table:
Organize the observed frequencies of the data into a contingency table.
Category 1 Category 2 Total Group 1 O11 O12 Row Total 1 Group 2 O21 O22 Row Total 2 Total Column Total 1 Column Total 2 Grand Total - Calculate Expected Frequencies:
Use the formula:
\[ E_{ij} = \frac{(\text{Row Total}_i) \times (\text{Column Total}_j)}{\text{Grand Total}} \]
for each cell in the table.
- Compute the Chi-Square Statistic:
Use the formula:
\[ \chi^2 = \sum \frac{(O_{ij} - E_{ij})^2}{E_{ij}} \]
where \( O_{ij} \) is the observed frequency and \( E_{ij} \) is the expected frequency for each cell.
- Determine the Degrees of Freedom:
The degrees of freedom (df) are calculated as:
\[ \text{df} = (r - 1) \times (c - 1) \]
where \( r \) is the number of rows and \( c \) is the number of columns.
- Find the Critical Value:
Use a Chi-Square distribution table to find the critical value based on the degrees of freedom and the chosen significance level (e.g., 0.05).
- Compare the Test Statistic to the Critical Value:
If the calculated Chi-Square statistic is greater than the critical value, reject the null hypothesis. Otherwise, do not reject the null hypothesis.
- Draw a Conclusion:
Interpret the results in the context of the research question.
By following these steps, you can determine whether there is a significant association between the two categorical variables being studied.
Examples of Chi-Square Test of Independence
The Chi-Square Test of Independence is a statistical method used to determine if there is a significant association between two categorical variables. Below are detailed examples demonstrating the application of this test:
Example 1: Gender and Political Party Preference
Suppose we want to examine whether gender is associated with political party preference. A survey is conducted with the following results:
| Republican | Democrat | Independent | Total | |
|---|---|---|---|---|
| Male | 120 | 90 | 40 | 250 |
| Female | 110 | 95 | 45 | 250 |
| Total | 230 | 185 | 85 | 500 |
To determine if there is an association, we perform the following steps:
- State the hypotheses:
- \(H_0\): Gender and political party preference are independent.
- \(H_1\): Gender and political party preference are not independent.
- Calculate the expected values:
- Calculate the test statistic:
- Determine the p-value:
- Conclusion:
For example, the expected value for Male Republicans is calculated as:
\[ \text{Expected value} = \frac{(\text{Row sum} \times \text{Column sum})}{\text{Total sum}} = \frac{(230 \times 250)}{500} = 115 \]
Repeating this for all cells, we get:
| Republican | Democrat | Independent | Total | |
|---|---|---|---|---|
| Male | 115 | 92.5 | 42.5 | 250 |
| Female | 115 | 92.5 | 42.5 | 250 |
| Total | 230 | 185 | 85 | 500 |
Using the formula:
\[ \chi^2 = \sum \frac{(O - E)^2}{E} \]
For Male Republicans:
\[ \chi^2 = \frac{(120 - 115)^2}{115} = 0.2174 \]
Repeating this for all cells, we sum the values:
\[ \chi^2 = 0.2174 + 0.0676 + 0.1471 + 0.2174 + 0.0676 + 0.1471 = 0.8642 \]
Using the chi-square distribution table, we find the p-value for \(\chi^2 = 0.8642\) with 2 degrees of freedom.
Since the p-value is greater than the significance level (0.05), we fail to reject the null hypothesis. Thus, there is not enough evidence to conclude that gender and political party preference are associated.
Example 2: Seat Location and Cheating
Another example involves determining if there is a relationship between where students sit in class and whether they have ever cheated. Data is collected as follows:
| No | Yes | Total | |
|---|---|---|---|
| Back | 24 | 8 | 32 |
| Front | 38 | 8 | 46 |
| Middle | 109 | 39 | 148 |
| Total | 171 | 55 | 226 |
Following similar steps, the test shows that the p-value is greater than the significance level, leading to the conclusion that there is no significant relationship between seat location and whether students have cheated.
Conditions for Using Chi-Square Test
The Chi-Square Test of Independence is a statistical method used to determine if there is a significant association between two categorical variables. However, certain conditions must be met to ensure the validity of the test results:
- Independence: The data should be collected through a process that ensures that each observation is independent of the others. This typically involves using a random sampling method.
- Categories: Both variables should be categorical. This means the data should be divided into groups or categories, such as "yes" or "no," "male" or "female," etc.
- Expected Frequency: The expected frequency count for each cell in the contingency table should be at least 5. If this condition is not met, the validity of the test may be compromised.
Meeting these conditions is crucial to conducting a valid Chi-Square Test of Independence, ensuring reliable and accurate conclusions about the relationship between the categorical variables under study.
Calculating Expected Values
The calculation of expected values is a crucial step in performing a Chi-Square Test of Independence. The expected frequency of each cell in a contingency table is calculated under the assumption that the two variables are independent. The formula to calculate the expected frequency for each cell is:
\[
E_{ij} = \frac{(R_i \times C_j)}{N}
\]
where:
- \(E_{ij}\) is the expected frequency for cell \((i, j)\)
- \(R_i\) is the total frequency for row \(i\)
- \(C_j\) is the total frequency for column \(j\)
- \(N\) is the total sample size
Let's illustrate this with an example:
Suppose we have the following contingency table representing the survey responses of 500 people based on their political affiliation and opinion on a tax reform bill:
| Favor | Indifferent | Oppose | Total | |
|---|---|---|---|---|
| Party A | 138 | 83 | 64 | 285 |
| Party B | 64 | 67 | 84 | 215 |
| Total | 202 | 150 | 148 | 500 |
To calculate the expected value for the cell where Party A favors the tax reform bill, we use the formula:
\[
E_{11} = \frac{(285 \times 202)}{500} = 115.14
\]
Similarly, we calculate the expected values for all other cells:
- \(E_{12} = \frac{(285 \times 150)}{500} = 85.50\)
- \(E_{13} = \frac{(285 \times 148)}{500} = 84.36\)
- \(E_{21} = \frac{(215 \times 202)}{500} = 86.86\)
- \(E_{22} = \frac{(215 \times 150)}{500} = 64.50\)
- \(E_{23} = \frac{(215 \times 148)}{500} = 63.64\)
These expected values can then be used to calculate the Chi-Square statistic, which will help determine if there is a significant association between the variables.
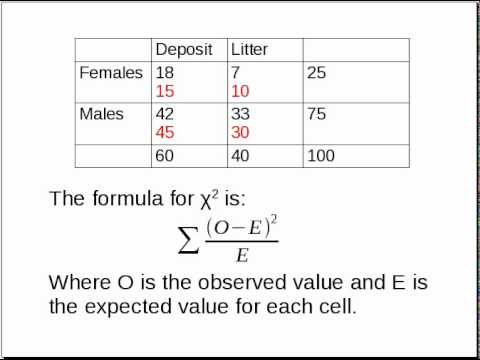
Calculating Chi-Square Test Statistic
The Chi-Square test statistic is calculated using the formula:
\[ \chi^2 = \sum \frac{(O_i - E_i)^2}{E_i} \]
Where:
- \( O_i \) = Observed frequency for category \( i \)
- \( E_i \) = Expected frequency for category \( i \)
To compute \( \chi^2 \):
- Calculate the expected frequencies \( E_i \) for each category based on the null hypothesis of independence.
- For each category, compute \( (O_i - E_i)^2 \).
- Divide each \( (O_i - E_i)^2 \) by \( E_i \).
- Sum all these values to obtain \( \chi^2 \).
The resulting \( \chi^2 \) value is then compared against a critical value from the Chi-Square distribution with degrees of freedom \( (r-1)(c-1) \), where \( r \) is the number of rows and \( c \) is the number of columns in the contingency table.
Interpreting the P-Value
The p-value in the context of a Chi-Square test of independence indicates the probability of obtaining a Chi-Square statistic as extreme as, or more extreme than, the one observed in the data, assuming that the null hypothesis is true.
Steps to interpret the p-value:
- Compare the calculated Chi-Square statistic \( \chi^2_{calc} \) with the critical Chi-Square value \( \chi^2_{crit} \) from the Chi-Square distribution table.
- If \( \chi^2_{calc} \) > \( \chi^2_{crit} \), then the p-value is smaller than the significance level \( \alpha \) (usually 0.05), suggesting that there is sufficient evidence to reject the null hypothesis of independence.
- If \( \chi^2_{calc} \) ≤ \( \chi^2_{crit} \), then the p-value is greater than \( \alpha \), indicating that there is not enough evidence to reject the null hypothesis.
A smaller p-value indicates stronger evidence against the null hypothesis, while a larger p-value suggests weaker evidence against it. Therefore, the interpretation of the p-value helps in determining the statistical significance of the Chi-Square test results.
Software and Tools for Chi-Square Test
Several software tools are commonly used to perform Chi-Square tests of independence:
- Minitab: Minitab is a statistical software package that offers comprehensive tools for data analysis, including Chi-Square tests.
- Excel: Microsoft Excel can be utilized for Chi-Square tests using built-in functions and data analysis tools.
- SPSS (Statistical Package for the Social Sciences): SPSS provides extensive capabilities for statistical analysis, including Chi-Square tests and other advanced analyses.
- Python: Python, with libraries such as SciPy and statsmodels, allows for performing Chi-Square tests programmatically, providing flexibility and customization.
- R: R is a programming language specifically designed for statistical computing and graphics, offering various packages like 'stats' and 'vcd' for conducting Chi-Square tests.
These software tools provide different approaches to performing Chi-Square tests, catering to various user preferences, data sizes, and analytical needs.
Xem video về Phân tích kiểm định Chi-Square cho độc lập để hiểu cách thực hiện và diễn dịch kết quả một cách chi tiết.
Video Chi-Square Test for Independence | Phân tích kiểm định Chi-Square cho độc lập
READ MORE:
Xem video về kiểm định độc lập sử dụng phân phối Chi-Square để hiểu cách thực hiện và diễn dịch kết quả một cách chi tiết.
Video Kiểm định Độc lập bằng Phân phối Chi-Square | Hướng dẫn chi tiết về kiểm định độc lập sử dụng phân phối Chi-Square

:max_bytes(150000):strip_icc()/Chi-SquareStatistic_Final_4199464-7eebcd71a4bf4d9ca1a88d278845e674.jpg)