Topic chi square test sample size calculator: Discover the essential guide to using a chi square test sample size calculator. This article provides a comprehensive overview of how to determine the appropriate sample size for your chi square tests, ensuring accurate and reliable statistical results. Whether you're a researcher or a student, this tool will streamline your data analysis process.
Table of Content
- Chi-Square Test Sample Size Calculator
- 1. Introduction to Chi-Square Tests
- 2. Types of Chi-Square Tests
- 3. Importance of Sample Size in Chi-Square Tests
- 4. Calculating Sample Size for Chi-Square Tests
- 5. Using Online Chi-Square Sample Size Calculators
- 6. Power Analysis for Chi-Square Tests
- 7. Examples of Chi-Square Test Calculations
- 8. Advanced Topics in Chi-Square Tests
- 9. Frequently Asked Questions (FAQs)
- 10. Conclusion
- YOUTUBE: Video này giải thích cách xác định kích thước mẫu cho bài kiểm tra Chi-squared để thu hút người xem.
Chi-Square Test Sample Size Calculator
The chi-square test is a statistical method used to determine if there is a significant association between two categorical variables. To ensure valid results, it is crucial to have an appropriate sample size. Below is a guide on using a chi-square test sample size calculator and understanding its outputs.
Key Components of Chi-Square Test
- Observed Frequencies: The actual data collected from the sample.
- Expected Frequencies: The frequencies expected under the null hypothesis.
- Degrees of Freedom (df): Calculated as the number of categories minus one.
- Significance Level (α): The probability threshold below which the null hypothesis is rejected.
- Effect Size (w): A measure of the strength of the association between variables.
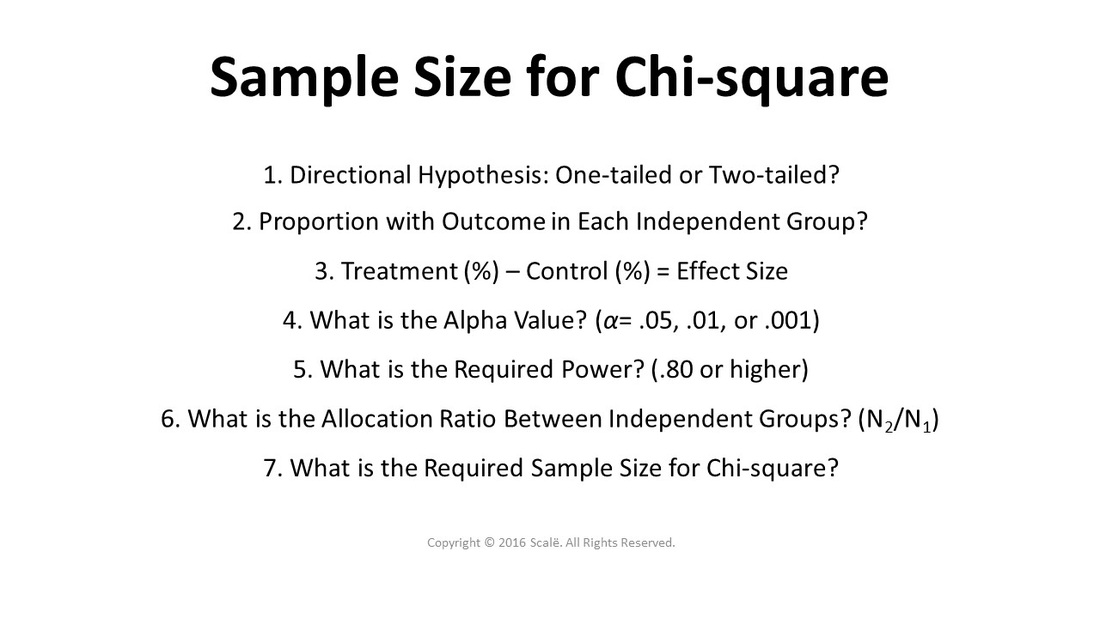
Sample Size Calculation
To calculate the sample size needed for a chi-square test, you need the following inputs:
- Significance Level (α): Commonly set at 0.05.
- Power (1-β): Typically set at 0.80 or 0.90.
- Effect Size (w): Small (0.1), medium (0.3), or large (0.5).
- Degrees of Freedom (df): Number of categories minus one.
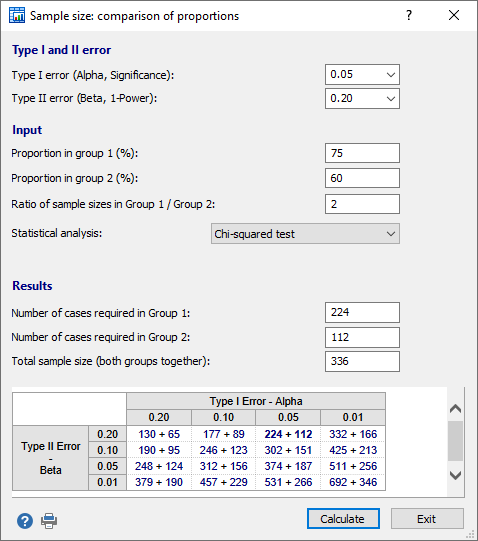
Using these inputs, the sample size calculator provides the minimum sample size required to detect a significant effect if it exists.
Example Calculations
Let's consider a scenario where you want to determine the sample size for a chi-square test with a significance level of 0.05, a power of 0.80, a medium effect size (w = 0.3), and 4 degrees of freedom. Using an online calculator, you would input these values to obtain the required sample size.
Popular Chi-Square Test Calculators
Conclusion
Understanding and calculating the appropriate sample size for a chi-square test is essential for valid and reliable statistical analysis. Using online calculators can simplify this process, allowing researchers to focus on interpreting results and drawing meaningful conclusions from their data.
For more detailed information and to use these tools, visit the provided links and enhance your data analysis skills.
READ MORE:
1. Introduction to Chi-Square Tests
The chi-square test is a statistical method used to determine if there is a significant association between two categorical variables. It is widely used in research to test hypotheses about the distribution of frequencies in different categories. The test compares the observed frequencies in each category to the frequencies that would be expected if there were no association between the variables.
There are several types of chi-square tests, including the chi-square goodness of fit test and the chi-square test of independence. The chi-square goodness of fit test determines if a sample matches the population, while the chi-square test of independence assesses whether two categorical variables are related.
To perform a chi-square test, you follow these steps:
- Formulate the hypotheses:
- Null Hypothesis (H0): Assumes no association between the variables, meaning the observed frequencies are equal to the expected frequencies.
- Alternative Hypothesis (HA): Assumes there is an association between the variables, meaning the observed frequencies differ from the expected frequencies.
- Calculate the expected frequencies for each category. This is usually done based on a theoretical distribution or previous research data.
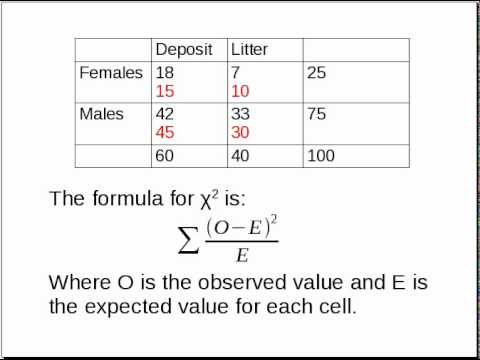
- Use the chi-square formula to calculate the test statistic: \[ \chi^2 = \sum \frac{(O_i - E_i)^2}{E_i} \] where \( O_i \) is the observed frequency and \( E_i \) is the expected frequency.
- Determine the degrees of freedom (df). For a chi-square test of independence, \( df = (r-1)(c-1) \), where \( r \) is the number of rows and \( c \) is the number of columns in the contingency table.
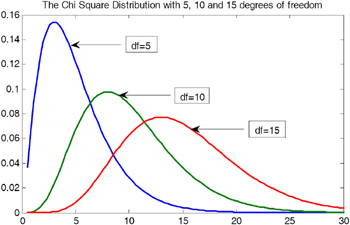
- Compare the calculated chi-square statistic to the critical value from the chi-square distribution table at the desired significance level (commonly 0.05) to determine whether to reject the null hypothesis.
Chi-square tests are powerful tools for analyzing categorical data and can be applied in various fields, including social sciences, biology, and marketing. They help researchers make informed decisions based on statistical evidence.
2. Types of Chi-Square Tests
The chi-square test is a statistical method used to determine if there is a significant association between categorical variables. There are several types of chi-square tests, each suited for different types of data and hypotheses.
-
Goodness of Fit Test
This test is used when you have a single categorical variable from a single population. It helps determine whether the observed sample distribution fits an expected distribution. The hypotheses for this test are:
- Null Hypothesis (H0): The observed frequencies match the expected frequencies.
- Alternative Hypothesis (HA): The observed frequencies do not match the expected frequencies.
Example: Testing if a die is fair by comparing the observed frequency of each face to the expected frequency (which is equal for a fair die).
-
Test of Independence
This test is used when you have two categorical variables from a single population. It assesses whether there is a significant association between the two variables. The hypotheses for this test are:
- Null Hypothesis (H0): The two variables are independent.
- Alternative Hypothesis (HA): The two variables are dependent.
Example: Testing if gender and voting preference are independent by comparing the observed frequencies in a contingency table.
-
Test of Homogeneity
This test is similar to the test of independence but is used to compare the distribution of a categorical variable across different populations. The hypotheses for this test are:
- Null Hypothesis (H0): The distributions of the categorical variable are the same across the populations.
- Alternative Hypothesis (HA): The distributions of the categorical variable are different across the populations.
Example: Testing if the distribution of a certain trait (like blood type) is the same across different regions.
-
McNemar's Test
This test is used for paired nominal data. It determines whether there are differences on a dichotomous dependent variable between two related groups. The hypotheses for this test are:
- Null Hypothesis (H0): The proportions of the two groups are the same.
- Alternative Hypothesis (HA): The proportions of the two groups are different.
Example: Testing if a treatment affects a binary outcome by comparing the before and after states of the same subjects.
3. Importance of Sample Size in Chi-Square Tests
The sample size in chi-square tests is crucial for several reasons. An appropriately sized sample ensures the reliability and validity of the test results, affecting both the statistical power and the accuracy of the conclusions drawn. Here, we delve into the key aspects of sample size importance:
-
Ensuring Statistical Power:
Statistical power is the probability that the test will correctly reject a false null hypothesis. A larger sample size increases the power of the chi-square test, making it more likely to detect a true effect when one exists. The power analysis helps in determining the minimum sample size required to achieve a desired power level, typically set at 0.8 or 80%.
-
Minimizing Type I and Type II Errors:
Adequate sample size reduces the risk of Type I errors (false positives) and Type II errors (false negatives). Type I errors occur when the null hypothesis is incorrectly rejected, while Type II errors happen when the null hypothesis is incorrectly accepted. A larger sample size helps in achieving a balance between these errors.
-
Accurate Estimation of Effect Sizes:
The effect size in chi-square tests, often represented by Cohen's w, is influenced by sample size. With a larger sample, the estimated effect size becomes more precise, allowing for a clearer understanding of the relationship between variables.
-
Compliance with Assumptions:
Chi-square tests assume that the expected frequency in each category should be at least 5. A larger sample size ensures that this assumption is met, enhancing the test's validity. If the sample size is too small, the test may yield unreliable results due to unmet assumptions.
-
Generalizability of Results:
With an adequate sample size, the results of the chi-square test are more likely to be generalizable to the larger population. This ensures that the findings are not limited to the sample used but can be applied more broadly.
In summary, determining the appropriate sample size is a critical step in planning chi-square tests. Using tools such as online sample size calculators can aid researchers in estimating the required sample size based on the desired power, significance level, and effect size. This careful planning enhances the reliability and validity of the statistical analysis.
4. Calculating Sample Size for Chi-Square Tests
Calculating the appropriate sample size for a Chi-Square test is essential to ensure the reliability and validity of the test results. Below, we outline the steps and factors to consider when calculating sample size for Chi-Square tests.
Steps to Calculate Sample Size
-
Define the Hypotheses: Clearly state the null and alternative hypotheses. For instance, in a test of independence, the null hypothesis might state that two variables are independent.
-
Determine the Effect Size (w): The effect size is a measure of the strength of the relationship between variables. Commonly used benchmarks for effect size in Chi-Square tests are 0.1 (small), 0.3 (medium), and 0.5 (large).
-
Set the Significance Level (α): The significance level, often set at 0.05, is the probability of rejecting the null hypothesis when it is true.
-
Choose the Desired Power (1-β): Power is the probability of correctly rejecting the null hypothesis. A typical value is 0.8, indicating an 80% chance of detecting an effect if there is one.
-
Calculate Degrees of Freedom: For a Chi-Square test, degrees of freedom are calculated based on the number of categories or groups being compared. For example, in a test of independence with a 2x2 contingency table, the degrees of freedom are (rows - 1) * (columns - 1).
-
Use a Sample Size Calculator: Utilize an online sample size calculator to input these parameters and obtain the required sample size. Various tools are available, such as StatsKingdom, Evan's Awesome A/B Tools, and CertifiedCalculator.com.
Factors Affecting Sample Size
Effect Size: Larger effect sizes require smaller sample sizes to detect a significant effect.
Significance Level: Lower significance levels (e.g., 0.01) require larger sample sizes.
Power: Higher desired power requires a larger sample size.
Number of Categories: More categories or groups in the test increase the required sample size.
Examples and Use Cases
Let's consider a few examples to illustrate the process:
-
Goodness of Fit Test: Suppose you want to test whether a die is fair. With 6 categories (faces of the die) and an effect size of 0.3, using a significance level of 0.05 and a power of 0.8, you can use a sample size calculator to determine the required number of rolls.
-
Test of Independence: Assume you are testing the independence of two categorical variables, such as gender and preference for a product. With a 2x2 contingency table, effect size of 0.3, significance level of 0.05, and power of 0.8, the sample size calculator will provide the necessary sample size.
Using these steps and understanding the influencing factors, you can ensure that your Chi-Square test is adequately powered to detect meaningful differences or associations in your data.
5. Using Online Chi-Square Sample Size Calculators
Online chi-square sample size calculators are powerful tools that help researchers determine the appropriate sample size needed to achieve desired statistical power for their chi-square tests. These calculators are particularly useful because they simplify complex calculations and provide quick results. Here is a detailed guide on using these calculators:
Overview of Online Tools
Several online tools are available for calculating sample sizes for chi-square tests. These tools typically require input parameters such as the expected effect size, the number of categories or degrees of freedom, and the desired level of statistical power and significance level (α). Some popular online calculators include:
Step-by-Step Guide to Using Calculators
Here's a step-by-step guide on how to use these calculators:
- Navigate to the chosen calculator's website.
- Enter the observed values and expected values in the provided fields. These values are typically separated by commas.
- Specify the significance level (α), usually set at 0.05 for a 95% confidence level.
- Set the desired power level, commonly 0.80 or 80%.
- Select the effect size (small, medium, or large), which can be guided by prior research or theoretical considerations.
- Input the number of categories or degrees of freedom, depending on the test type.
- Click the "Calculate" button to obtain the sample size estimate.
Popular Online Calculators
Below are some features of popular online chi-square sample size calculators:
- StatsKingdom Chi-Square Sample Size Calculator: This calculator is user-friendly and provides detailed instructions on inputting data and interpreting results. It includes options for different chi-square tests, including goodness of fit and independence tests.
- Social Science Statistics Chi-Square Calculator: This tool allows users to create contingency tables with up to five rows and five columns, making it versatile for various study designs.
- NewTum Chi-Square Calculator: Focuses on data security by performing all calculations on the local device, ensuring that sensitive data remains private.
- Certified Calculator Chi-Square Sample Size Calculator: This tool is comprehensive, offering FAQs and detailed guidance on how to use the calculator for different chi-square test scenarios.
Using these online calculators can significantly streamline the process of determining the required sample size for your chi-square tests, ensuring your study is well-powered and statistically robust.
6. Power Analysis for Chi-Square Tests
Power analysis is a critical aspect of statistical testing, including Chi-Square tests. It helps determine the likelihood that the test will detect an effect if there is one. Here, we will discuss the importance of power analysis, steps to perform it, and tools available for conducting power analysis for Chi-Square tests.
Definition and Importance of Power Analysis
Power analysis allows researchers to determine the sample size required to detect an effect of a given size with a certain degree of confidence. It helps in ensuring that the test is neither underpowered (risking Type II errors) nor overpowered (unnecessarily large sample size).
- Power (1 - β): The probability that the test correctly rejects the null hypothesis when a true effect exists.
- Significance Level (α): The probability of rejecting the null hypothesis when it is true (Type I error).
- Effect Size: The magnitude of the difference or association that the test aims to detect.
How to Perform Power Analysis
Performing power analysis for Chi-Square tests involves the following steps:
- Determine the Effect Size: Use measures such as Cramer's V or Phi coefficient. For example, Cramer's V is calculated as \( V = \sqrt{\frac{X^2}{n \times \text{df}}} \), where \( X^2 \) is the Chi-Square statistic, \( n \) is the total sample size, and \( \text{df} \) is the degrees of freedom.
- Set the Significance Level (α): Commonly set at 0.05, this is the threshold for rejecting the null hypothesis.
- Choose the Desired Power Level: Typically, a power of 0.80 (or 80%) is considered standard, meaning there is an 80% chance of detecting an effect if there is one.
- Calculate the Required Sample Size: Use power analysis formulas or software to find the minimum sample size needed. This ensures that the study is adequately powered to detect the expected effect size.
Tools for Power Analysis
Several online tools and software can help perform power analysis for Chi-Square tests:
- G*Power: A widely used tool for power analysis in various statistical tests, including Chi-Square tests.
- StatsKingdom: Provides an online Chi-Square power calculator that allows users to input effect size, significance level, and desired power to calculate the required sample size.
- Statology: Offers detailed guides and calculators for conducting power analysis and understanding effect sizes in Chi-Square tests.
Example of Power Analysis
Consider a Chi-Square test for independence with 3 intervention groups and 2 outcome groups. To perform power analysis:
- Calculate the effect size using Cramer's V.
- Set the significance level (e.g., α = 0.05).
- Choose a desired power level (e.g., 0.80).
- Use a power analysis calculator or software to determine the required sample size. For instance, if the effect size is medium (V = 0.3) and α = 0.05, the calculator may suggest a sample size of around 200 participants to achieve 80% power.
Conducting power analysis ensures that your Chi-Square test is well-designed and capable of detecting meaningful effects, thereby enhancing the reliability and validity of your research findings.
7. Examples of Chi-Square Test Calculations
In this section, we will provide detailed examples of different types of Chi-Square tests. Each example will walk you through the steps involved in performing the test, interpreting the results, and understanding the implications.
Goodness of Fit Example
Let's say we want to test whether a six-sided die is fair. We roll the die 60 times and observe the following frequencies:
- 1: 8
- 2: 10
- 3: 9
- 4: 12
- 5: 11
- 6: 10
We expect each number to appear 10 times (since 60 rolls divided by 6 sides equals 10). The Chi-Square statistic is calculated as follows:
\[
\chi^2 = \sum \frac{(O_i - E_i)^2}{E_i}
\]
- \(O_i\) = observed frequency
- \(E_i\) = expected frequency
For our example, the calculation would be:
\[
\chi^2 = \frac{(8-10)^2}{10} + \frac{(10-10)^2}{10} + \frac{(9-10)^2}{10} + \frac{(12-10)^2}{10} + \frac{(11-10)^2}{10} + \frac{(10-10)^2}{10} = 0.4 + 0 + 0.1 + 0.4 + 0.1 + 0 = 1.0
\]
With 5 degrees of freedom (number of categories - 1), we compare the calculated Chi-Square value to the critical value from the Chi-Square distribution table. If our value exceeds the critical value, we reject the null hypothesis that the die is fair.
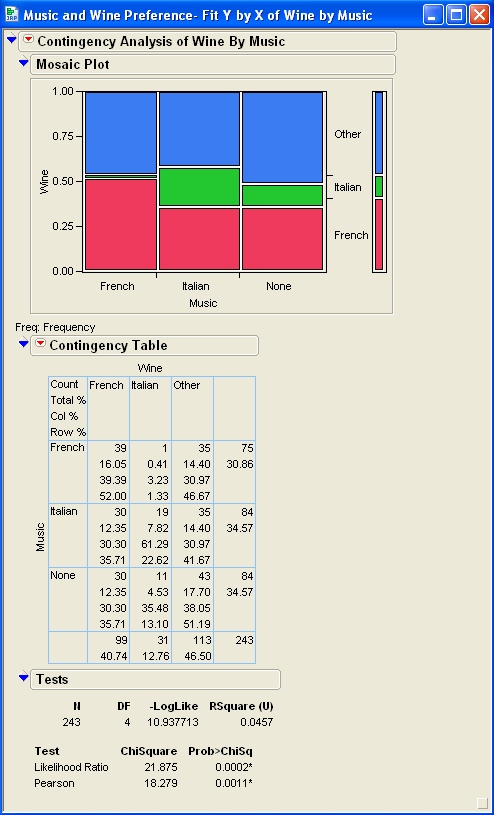
Test of Independence Example
Consider a study examining whether there is an association between gender (male, female) and preference for a new product (like, dislike). The observed data is:
| Like | Dislike | |
|---|---|---|
| Male | 20 | 30 |
| Female | 25 | 25 |
To perform the Chi-Square Test of Independence, we calculate the expected frequencies assuming no association between gender and preference. The expected frequency for each cell is calculated as:
\[
E_{ij} = \frac{(row\, total) \times (column\, total)}{grand\, total}
\]
For example, the expected frequency for males who like the product is:
\[
E_{11} = \frac{(50) \times (45)}{100} = 22.5
\]
We then calculate the Chi-Square statistic using the formula provided earlier and compare it to the critical value from the Chi-Square distribution with the appropriate degrees of freedom.
Homogeneity Test Example
Suppose we want to test if the distribution of job satisfaction levels is the same across three different companies. We collect the following data:
| Company A | Company B | Company C | |
|---|---|---|---|
| Low | 15 | 10 | 20 |
| Medium | 30 | 25 | 30 |
| High | 25 | 15 | 10 |
We calculate the expected frequencies for each cell and use the Chi-Square formula to determine if there are significant differences in job satisfaction distributions across the companies.
McNemar's Test Example
Consider a study evaluating the effectiveness of a new medication. We have paired data before and after treatment:
| After Treatment: No | After Treatment: Yes | |
|---|---|---|
| Before Treatment: No | 30 | 5 |
| Before Treatment: Yes | 10 | 55 |
McNemar's Test focuses on the discordant pairs (5 and 10). The test statistic is:
\[
\chi^2 = \frac{(|b - c| - 1)^2}{b + c}
\]
For our data, this would be:
\[
\chi^2 = \frac{(|5 - 10| - 1)^2}{5 + 10} = \frac{(5 - 1)^2}{15} = \frac{16}{15} \approx 1.07
\]
We then compare this value to the critical value from the Chi-Square distribution with 1 degree of freedom.
8. Advanced Topics in Chi-Square Tests
Chi-square tests have a variety of advanced applications and considerations. These advanced topics help refine the use of chi-square tests in specific and complex scenarios.
Handling Small Sample Sizes
When dealing with small sample sizes, the chi-square test may not be valid due to the low frequency in some categories. In such cases, Fisher's Exact Test is a recommended alternative as it provides exact p-values and is not reliant on large sample assumptions.
Chi-Square Tests with Multiple Categories
When performing chi-square tests with multiple categories, it’s important to ensure that the expected frequency in each category is sufficiently large. The general rule is that each expected frequency should be at least 5. If this condition is not met, combining categories or using exact tests can help maintain the validity of the results.
Adjustments for Continuity
The chi-square test can be adjusted for continuity using Yates' correction for continuity, especially for 2x2 contingency tables. This correction helps to reduce the error when the sample size is small and can make the test more conservative. The adjusted chi-square statistic is calculated as:
\[
\chi^2 = \sum \frac{(|O_i - E_i| - 0.5)^2}{E_i}
\]
where \(O_i\) represents the observed frequency and \(E_i\) represents the expected frequency.
Combining Categories
In cases where some categories have very low frequencies, it might be necessary to combine these categories to meet the assumptions of the chi-square test. This ensures that the expected frequency in each combined category is sufficient to apply the chi-square test effectively.
Use of Software Tools
Several software tools and online calculators are available to assist with chi-square tests, especially for complex datasets or advanced applications. Tools such as R, Python libraries (SciPy), and specialized online calculators can automate calculations and provide more accurate results. These tools also often include options for continuity correction and handling small sample sizes.
Understanding and applying these advanced topics ensures the appropriate use of chi-square tests and enhances the reliability of statistical conclusions drawn from categorical data.
9. Frequently Asked Questions (FAQs)
-
Q1: What is a Chi-Square Test of Independence?
The Chi-Square Test of Independence is a statistical method used to determine if there is a significant association between two or more categorical variables. It helps in identifying whether the variables are independent or related in a given dataset.
-
Q2: When should I use a Chi-Square Test?
You should use a Chi-Square Test when you want to examine the relationship between categorical variables. It is widely used in fields like healthcare, social sciences, and marketing research to test hypotheses about associations between variables.
-
Q3: What is the p-value in a Chi-Square Test?
The p-value represents the probability that the observed data occurred by chance under the null hypothesis. A p-value less than 0.05 typically indicates a statistically significant relationship between the variables being studied.
-
Q4: How do I report the results in APA style?
To report Chi-Square Test results in APA style, you should include the purpose of the test, sample size, observed frequencies, Chi-Square statistic (χ²), degrees of freedom, p-value, effect size, and interpretation of the findings. It’s also useful to add details like adjusted residuals and graphical representations if applicable.
-
Q5: What is the effect size in a Chi-Square Test?
Effect size measures, such as Cramer's V or the Phi coefficient, quantify the strength of the relationship between variables. Effect sizes are categorized as small (0.1), medium (0.3), or large (0.5), helping to understand the practical significance of the results.
-
Q6: How do I calculate the sample size for a Chi-Square Test?
Calculating sample size for a Chi-Square Test involves specifying the desired power level (commonly 0.8), significance level (usually 0.05), effect size, and the degrees of freedom based on the number of categories in your variables. Online calculators can assist in determining the necessary sample size by inputting these parameters.
-
Q7: What are the assumptions of the Chi-Square Test?
The main assumptions of the Chi-Square Test include that the data are in the form of frequencies or counts, the samples are independent, the variables are categorical, and the expected frequency in each cell should be at least 5 for the test to be valid.
-
Q8: Can Chi-Square Tests be used with small sample sizes?
While Chi-Square Tests are less reliable with small sample sizes, they can still be used with caution. If the expected frequencies are too low, alternative methods like Fisher’s Exact Test may be more appropriate.
-
Q9: How do I interpret the results of a Chi-Square Test?
To interpret the results of a Chi-Square Test, compare the p-value to your significance level. If the p-value is less than the significance level, reject the null hypothesis and conclude that there is a significant association between the variables. Also, consider the effect size to understand the practical significance of the association.
-
Q10: What are some common issues in Chi-Square Tests?
Common issues in Chi-Square Tests include low expected frequencies, violations of independence, and misinterpretation of p-values. Ensuring adequate sample size and meeting the test assumptions are crucial for reliable results.
10. Conclusion
The chi-square test is an invaluable tool in the realm of statistical analysis, particularly when dealing with categorical data. Throughout this guide, we've explored the various types of chi-square tests, the critical role of sample size, and how to effectively use online calculators to simplify the process. Additionally, we've delved into the importance of power analysis to ensure the robustness of our tests.
By examining real-life examples, we've demonstrated the practical applications of chi-square tests in diverse fields such as marketing, education, sociology, and environmental science. These examples highlight how the chi-square test can uncover significant associations between variables, providing insights that drive decision-making and strategy development.
Advanced topics such as handling small sample sizes, dealing with multiple categories, and applying continuity corrections have also been covered, equipping you with a comprehensive understanding of this statistical method. The FAQs section addressed common queries and troubleshooting tips, further solidifying your knowledge.
In conclusion, the chi-square test is more than just a statistical method; it is a gateway to uncovering hidden relationships within your data. As we continue to generate and analyze vast amounts of data, the chi-square test will remain a cornerstone in transforming raw data into actionable insights. Embrace this tool, leverage online calculators to ease the computational burden, and apply your newfound knowledge to enhance your research and analytical endeavors.
We encourage you to explore further resources and continue your journey in mastering statistical analysis. The chi-square test is just the beginning of a deeper understanding of data and its implications. Whether you are a student, researcher, or professional, the ability to conduct and interpret chi-square tests will undoubtedly enhance your analytical capabilities and contribute to more informed decision-making.
Video này giải thích cách xác định kích thước mẫu cho bài kiểm tra Chi-squared để thu hút người xem.
Kích thước mẫu Chi-squared
READ MORE:
Video này giải thích cách xác định kích thước mẫu tối thiểu cho bài kiểm tra Chi-squared để thu hút người xem.
Kích thước mẫu tối thiểu Chi-squared


:max_bytes(150000):strip_icc()/Chi-SquareStatistic_Final_4199464-7eebcd71a4bf4d9ca1a88d278845e674.jpg)
