Topic minimum sample size for chi square test: Determining the minimum sample size for a Chi Square test is crucial for accurate statistical analysis. This article delves into the essential guidelines and tips to ensure robust results, covering key concepts, assumptions, and practical steps for conducting the test effectively.
Table of Content
- Minimum Sample Size for Chi-Square Test
- Introduction
- Understanding the Chi Square Test
- Types of Chi Square Tests
- Assumptions and Conditions
- Determining Minimum Sample Size
- Expected Frequencies
- Steps to Perform Chi Square Test
- Examples and Applications
- Alternative Tests for Small Sample Sizes
- Using Statistical Software
- Conclusion
- YOUTUBE:
Minimum Sample Size for Chi-Square Test
The chi-square test is a statistical method used to determine if there is a significant association between categorical variables. Here, we will explore the minimum sample size required for a chi-square test to be valid and effective.
General Guidelines
- The sample size should ideally be large enough to ensure that the expected frequency in each cell of a contingency table is at least 5. This rule is crucial to ensure the validity of the chi-square test results.
- If the expected frequency is less than 5, alternative tests such as Fisher’s Exact Test may be more appropriate.
Specific Criteria for Expected Counts
Different researchers and statistical guidelines provide varying thresholds for the minimum sample size and expected counts:
- According to Cochran (1952, 1954), all expected counts should be 10 or greater. If they are between 5 and 10, Yates’ Correction for continuity should be applied.
- Moore & McCabe (1999) suggest that for tables larger than 2x2, no more than 20% of expected counts should be less than 5, and all individual expected counts should be at least 1.
- For 2x2 tables, if the sample size is small, Fisher’s Exact Test is recommended over the chi-square test.
Chi-Square Test Types
- Chi-square goodness of fit test: Used when you have one categorical variable to see if the observed distribution matches an expected distribution.
- Chi-square test of independence: Used when you have two categorical variables to determine if there is a significant association between them.
Strengths and Limitations
| Strengths | Limitations |
|
|
Example Calculation
To perform a chi-square test, follow these steps:
- Create a table of observed and expected frequencies.
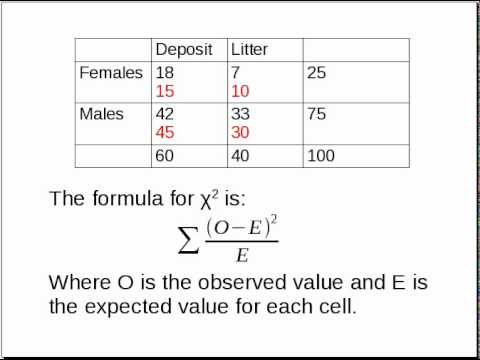
- Calculate the chi-square statistic using the formula: \[ \chi^2 = \sum \frac{(O_i - E_i)^2}{E_i} \] where \( O_i \) is the observed frequency and \( E_i \) is the expected frequency.
- Compare the calculated chi-square value to the critical value from the chi-square distribution table.
- Decide whether to reject the null hypothesis based on the comparison.
In summary, ensuring an adequate sample size and expected counts is essential for the validity of chi-square tests. When the expected counts are low, consider alternative statistical methods to ensure accurate results.

READ MORE:
Introduction
The Chi Square test is a statistical method used to determine if there is a significant association between categorical variables. Ensuring an adequate sample size is crucial for the validity of the test results. This section provides an in-depth understanding of the factors influencing the minimum sample size and guidelines to achieve accurate and reliable outcomes.
Key points to consider include:
- Importance of sample size in statistical tests
- Factors influencing minimum sample size for Chi Square tests
- General guidelines for calculating sample size
To ensure the Chi Square test is effective, researchers must understand the following concepts:
- Expected Frequencies: Each cell in a contingency table should have an expected frequency of at least 5. This is to avoid inaccuracies in the test results.
- Degrees of Freedom: The formula for degrees of freedom in a Chi Square test is given by:
- Effect Size: A larger sample size is required to detect smaller effect sizes. Effect size measures the strength of the relationship between variables.
\[
\text{Degrees of Freedom} = (r - 1) \times (c - 1)
\]
where \( r \) is the number of rows and \( c \) is the number of columns in the contingency table.
By considering these factors, researchers can determine the appropriate minimum sample size required for their specific Chi Square test, ensuring the reliability and validity of their statistical analysis.
Understanding the Chi Square Test
The Chi Square test is a non-parametric statistical test used to determine if there is a significant association between categorical variables. It compares the observed frequencies in each category with the frequencies that would be expected if there were no association between the variables.
Key concepts include:
- Observed Frequencies: The actual count of cases in each category from the collected data.
- Expected Frequencies: The count of cases expected in each category if there were no relationship between the variables, calculated using the formula:
\[
E = \frac{(row \, total) \times (column \, total)}{grand \, total}
\]
Steps to perform the Chi Square test:
- Formulate Hypotheses:
- Null Hypothesis (\( H_0 \)): Assumes no association between the variables.
- Alternative Hypothesis (\( H_A \)): Assumes there is an association between the variables.
- Calculate Expected Frequencies: Use the formula provided above to find the expected frequency for each cell in the contingency table.
- Compute the Chi Square Statistic: The formula for the Chi Square statistic is:
- Determine Degrees of Freedom: Calculated as:
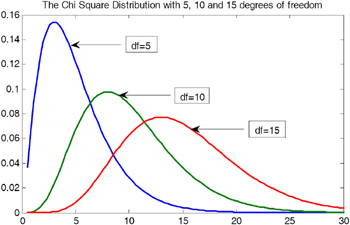
- Find the Critical Value: Use the Chi Square distribution table to find the critical value based on the calculated degrees of freedom and the chosen significance level (usually 0.05).
- Compare and Conclude: Compare the Chi Square statistic to the critical value to determine whether to reject the null hypothesis.
\[
\chi^2 = \sum \frac{(O - E)^2}{E}
\]
where \( O \) is the observed frequency and \( E \) is the expected frequency.
\[
df = (r - 1) \times (c - 1)
\]
where \( r \) is the number of rows and \( c \) is the number of columns.
The Chi Square test is widely used in research to test relationships between categorical variables, providing valuable insights into data patterns and associations.
Types of Chi Square Tests
There are several types of Chi Square tests, each designed to assess different kinds of categorical data. The main types are:
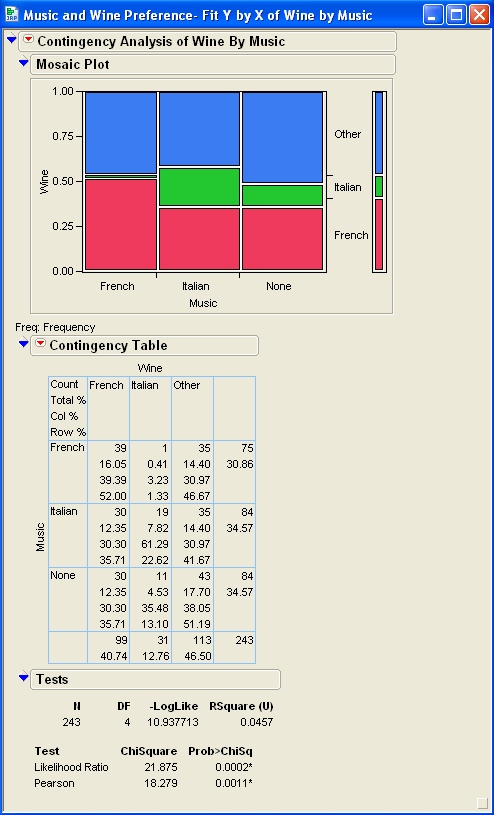
- Chi Square Test for Independence: This test determines if there is a significant association between two categorical variables in a contingency table. It compares the observed frequencies to the expected frequencies to see if they are independent.
- Chi Square Goodness of Fit Test: This test evaluates whether the observed frequency distribution of a single categorical variable matches an expected distribution. It is used to see if sample data fits a population with a specific distribution.
- Chi Square Test for Homogeneity: This test assesses whether different samples come from populations with the same distribution. It is similar to the test for independence but is used when comparing distributions across different populations.
Steps to perform each test:
- Chi Square Test for Independence:
- Formulate the hypotheses:
- Null Hypothesis (\( H_0 \)): The variables are independent.
- Alternative Hypothesis (\( H_A \)): The variables are not independent.
- Construct the contingency table and calculate the expected frequencies.
- Compute the Chi Square statistic:
\[
\chi^2 = \sum \frac{(O - E)^2}{E}
\]
where \( O \) is the observed frequency and \( E \) is the expected frequency. - Determine the degrees of freedom:
\[
df = (r - 1) \times (c - 1)
\]
where \( r \) is the number of rows and \( c \) is the number of columns. - Compare the Chi Square statistic to the critical value from the Chi Square distribution table.
- Make a decision to reject or not reject the null hypothesis.
- Formulate the hypotheses:
- Chi Square Goodness of Fit Test:
- Formulate the hypotheses:
- Null Hypothesis (\( H_0 \)): The observed frequencies fit the expected distribution.
- Alternative Hypothesis (\( H_A \)): The observed frequencies do not fit the expected distribution.
- Calculate the expected frequencies based on the expected distribution.
- Compute the Chi Square statistic using the same formula as above.
- Determine the degrees of freedom:
\[
df = k - 1
\]
where \( k \) is the number of categories. - Compare the Chi Square statistic to the critical value and make a decision.
- Formulate the hypotheses:
- Chi Square Test for Homogeneity:
- Formulate the hypotheses:
- Null Hypothesis (\( H_0 \)): The distributions are homogeneous across populations.
- Alternative Hypothesis (\( H_A \)): The distributions are not homogeneous.
- Construct the contingency table for different populations and calculate expected frequencies.
- Compute the Chi Square statistic using the same formula as above.
- Determine the degrees of freedom using the same formula as the test for independence.
- Compare the Chi Square statistic to the critical value and make a decision.
- Formulate the hypotheses:
Each type of Chi Square test provides valuable insights into categorical data relationships, helping researchers draw meaningful conclusions from their data.
Assumptions and Conditions
For the Chi Square test to yield valid results, certain assumptions and conditions must be met. These include:
- Independence: Observations must be independent of each other. This means that the occurrence of one event does not affect the occurrence of another.
- Sample Size: The sample size should be sufficiently large. Specifically, each expected frequency should be at least 5 to ensure the Chi Square approximation is valid.
- Categorical Data: The data must be in the form of counts or frequencies for categories, not continuous data.
- Random Sampling: The data should be obtained through a process of random sampling to ensure each member of the population has an equal chance of being included.
The steps to ensure these assumptions and conditions are met include:
- Check for Independence: Ensure that the data collection method ensures that each observation is independent. This can often be achieved through random sampling techniques.
- Calculate Expected Frequencies: Verify that all expected frequencies are at least 5. This can be calculated using the formula:
\[
E = \frac{(row \, total) \times (column \, total)}{grand \, total}
\] - Ensure Categorical Data: Confirm that the data collected is categorical. Convert any continuous data into categories if necessary before applying the Chi Square test.
- Use Random Sampling Methods: Utilize appropriate random sampling techniques to gather the data, ensuring that each individual in the population has an equal chance of selection.
By adhering to these assumptions and conditions, researchers can confidently use the Chi Square test to analyze categorical data, leading to accurate and reliable conclusions.
Determining Minimum Sample Size
Determining the minimum sample size for a Chi Square test is essential to ensure valid and reliable results. Several factors influence the calculation, including the desired level of significance, the power of the test, the effect size, and the degrees of freedom.
Steps to determine the minimum sample size:
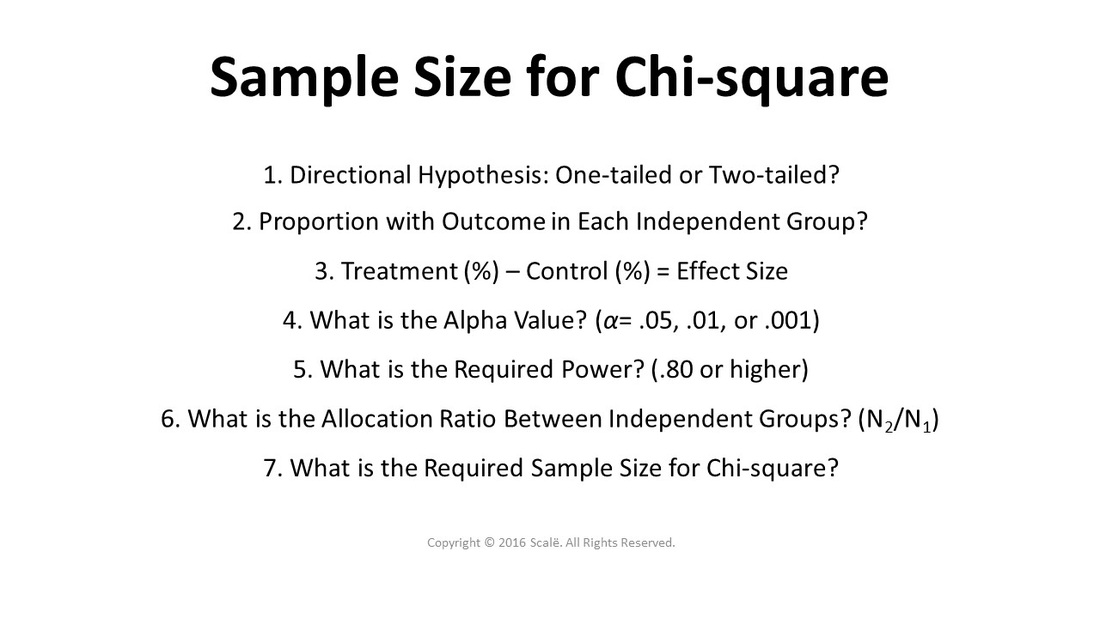
- Define the Significance Level (\( \alpha \)): Commonly set at 0.05, this is the probability of rejecting the null hypothesis when it is true.
- Choose the Power of the Test (\( 1 - \beta \)): Typically set at 0.80, this is the probability of correctly rejecting the null hypothesis when it is false.
- Estimate the Effect Size: The effect size measures the strength of the relationship between variables. Cohen's guidelines suggest 0.1 for small, 0.3 for medium, and 0.5 for large effect sizes.
- Calculate Degrees of Freedom: Use the formula:
\[
df = (r - 1) \times (c - 1)
\]
where \( r \) is the number of rows and \( c \) is the number of columns in the contingency table. - Use a Sample Size Calculator or Statistical Software: Input the significance level, power, effect size, and degrees of freedom into a sample size calculator or statistical software to determine the minimum sample size needed.
As a rule of thumb, ensure that the expected frequencies in each cell are at least 5 to meet the assumptions of the Chi Square test. The following table summarizes the guidelines for different levels of effect sizes:
| Effect Size | Small (0.1) | Medium (0.3) | Large (0.5) |
|---|---|---|---|
| Minimum Sample Size | At least 300 | At least 50 | At least 20 |
By following these steps and guidelines, researchers can determine an appropriate minimum sample size for their Chi Square tests, ensuring robust and reliable statistical analysis.
Expected Frequencies
Expected frequencies are a crucial component in the Chi Square test. They represent the counts we would expect in each category if there were no association between the variables. Calculating expected frequencies accurately ensures the validity of the Chi Square test results.
The formula for calculating expected frequencies in a contingency table is:
\[
E = \frac{(row \, total) \times (column \, total)}{grand \, total}
\]
Steps to calculate expected frequencies:
- Construct the Contingency Table: Create a table summarizing the observed frequencies for each combination of categorical variables.
- Calculate Row Totals and Column Totals: Sum the observed frequencies for each row and each column.
- Compute the Grand Total: Sum all the observed frequencies in the table.
- Apply the Formula: Use the formula to calculate the expected frequency for each cell in the table. For each cell:
\[
E_{ij} = \frac{(row \, total_i) \times (column \, total_j)}{grand \, total}
\]
where \( E_{ij} \) is the expected frequency for the cell in the i-th row and j-th column.
An example to illustrate the calculation:
| Category A | Category B | Total |
|---|---|---|
| Observed: 30 | Observed: 20 | Row Total: 50 |
| Observed: 10 | Observed: 40 | Row Total: 50 |
| Column Total: 40 | Column Total: 60 | Grand Total: 100 |
Using the formula, the expected frequency for the first cell (Category A, Row 1) is calculated as:
\[
E_{11} = \frac{(50) \times (40)}{100} = 20
\]
Repeat this calculation for each cell in the table to obtain all expected frequencies.
Ensuring that all expected frequencies are at least 5 is essential to meet the assumptions of the Chi Square test. This condition helps in obtaining accurate and reliable test results.
Steps to Perform Chi Square Test
The Chi Square test is a statistical method used to determine if there is a significant association between categorical variables. Here are the detailed steps to perform the Chi Square test:
- Formulate Hypotheses:
- Null Hypothesis (\( H_0 \)): Assumes no association between the variables.
- Alternative Hypothesis (\( H_A \)): Assumes there is an association between the variables.
- Collect Data: Gather the data and organize it into a contingency table showing the frequency distribution of the variables.
- Calculate Expected Frequencies: Use the formula:
\[
E = \frac{(row \, total) \times (column \, total)}{grand \, total}
\]
to calculate the expected frequency for each cell in the contingency table. - Compute the Chi Square Statistic: Use the formula:
\[
\chi^2 = \sum \frac{(O - E)^2}{E}
\]
where \( O \) is the observed frequency and \( E \) is the expected frequency. - Determine Degrees of Freedom: Calculate the degrees of freedom using:
\[
df = (r - 1) \times (c - 1)
\]
where \( r \) is the number of rows and \( c \) is the number of columns. - Find the Critical Value: Use the Chi Square distribution table to find the critical value based on the calculated degrees of freedom and the chosen significance level (usually 0.05).
- Compare Chi Square Statistic to Critical Value: Compare the computed Chi Square statistic to the critical value:
- If \( \chi^2 \) is greater than the critical value, reject the null hypothesis.
- If \( \chi^2 \) is less than or equal to the critical value, do not reject the null hypothesis.
- Make a Decision: Based on the comparison, conclude whether there is a significant association between the variables.
An example of a Chi Square test calculation:
| Category A | Category B | Total |
|---|---|---|
| Observed: 30 | Observed: 20 | Row Total: 50 |
| Observed: 10 | Observed: 40 | Row Total: 50 |
| Column Total: 40 | Column Total: 60 | Grand Total: 100 |
For the first cell (Category A, Row 1), the expected frequency is calculated as:
\[
E_{11} = \frac{(50) \times (40)}{100} = 20
\]
Repeat the calculation for each cell, then compute the Chi Square statistic, compare it to the critical value, and make a decision based on the result.
Examples and Applications
The Chi Square test is widely used in various fields to determine if there is a significant association between categorical variables. Here are some examples and applications:
Example 1: Testing Independence in a Contingency Table
Consider a study investigating the relationship between gender and preference for a new product. The data is organized as follows:
| Prefer | Do Not Prefer | Total | |
|---|---|---|---|
| Male | 60 | 40 | 100 |
| Female | 30 | 70 | 100 |
| Total | 90 | 110 | 200 |
The expected frequency for the first cell (Male, Prefer) is:
\[
E_{11} = \frac{(100 \times 90)}{200} = 45
\]
Repeat this calculation for all cells and then compute the Chi Square statistic to test for independence.
Example 2: Goodness-of-Fit Test
A researcher wants to determine if a die is fair. The observed frequencies of rolls are:
| Face | Frequency |
|---|---|
| 1 | 8 |
| 2 | 12 |
| 3 | 10 |
| 4 | 9 |
| 5 | 11 |
| 6 | 10 |
The expected frequency for each face (if the die is fair) is:
\[
E = \frac{60}{6} = 10
\]
Compute the Chi Square statistic using the observed and expected frequencies to test if the die is fair.
Applications
- Marketing: Analyzing consumer preferences and behaviors based on demographic categories.
- Health Sciences: Examining the association between lifestyle factors and health outcomes.
- Social Sciences: Investigating relationships between social variables such as education level and voting patterns.
- Quality Control: Testing if the distribution of defects in a manufacturing process follows a specific pattern.
These examples and applications demonstrate the versatility of the Chi Square test in analyzing categorical data across different fields, providing valuable insights into relationships and patterns.
Alternative Tests for Small Sample Sizes
When dealing with small sample sizes, the chi-square test may not be appropriate due to its requirement for a minimum expected frequency in each category. Several alternative tests can be used to analyze small sample sizes effectively:
1. Fisher's Exact Test
Fisher's Exact Test is particularly useful for small sample sizes and 2x2 contingency tables. It calculates the exact probability of observing the data assuming the null hypothesis is true. This test does not rely on large sample approximations and is a robust alternative when sample sizes are very small.
Assumptions:
- Independence of observations
- Fixed row and column totals
2. Yates' Correction for Continuity
Yates' Correction is applied to the chi-square test for 2x2 tables to reduce the error introduced by the approximation of the chi-square distribution. This correction is more accurate for small sample sizes.
3. Exact Binomial Test
The exact binomial test can be used when testing hypotheses about the probability of success in a Bernoulli experiment. This test is applicable when you have a small number of trials and you are testing the observed proportion against a specified proportion.
Example:
binom.test(x, n, p = 0.5)where x is the number of successes, n is the number of trials, and p is the hypothesized probability of success.
4. Monte Carlo Simulation
For chi-square tests with small sample sizes, a Monte Carlo simulation can be used to obtain an approximate p-value. This involves generating a large number of random samples to simulate the sampling distribution of the test statistic under the null hypothesis.
Example in R:
chisq.test(observed, simulate.p.value=TRUE, B=10000)where observed is the vector of observed frequencies, and B is the number of simulations.
5. Bayesian Methods
Bayesian statistical methods can be particularly useful for small sample sizes because they incorporate prior information into the analysis. Bayesian approaches can provide more informative results by combining prior knowledge with the observed data.
These alternative methods provide more accurate and reliable results for small sample sizes compared to the traditional chi-square test. It is crucial to choose the appropriate test based on the specific conditions and characteristics of your data.
Using Statistical Software
Statistical software can significantly simplify the process of conducting a Chi Square test, from calculating the test statistic to interpreting the results. Here’s a step-by-step guide on how to use some popular statistical software for this purpose.
1. Using SPSS
- Open SPSS and load your dataset.
- Go to Analyze > Descriptive Statistics > Crosstabs.
- Select the variables you want to analyze and move them to the Row(s) and Column(s) boxes.
- Click on Statistics and check Chi-square.
- Click Continue and then OK to run the test.
- SPSS will output the Chi Square test statistic, degrees of freedom, and p-value in the output window.
2. Using R
R is a powerful tool for statistical analysis, including Chi Square tests. Below is an example of how to perform a Chi Square test using R:
# Load the data
data <- matrix(c(15, 12, 9, 8, 8, 6), nrow = 2, byrow = TRUE)

# Perform the Chi Square test
result <- chisq.test(data)

# View the result
print(result)
This script loads a dataset into a matrix and then performs the Chi Square test using the chisq.test function. The result includes the Chi Square statistic, degrees of freedom, and p-value.
3. Using SAS
- Load your data into SAS.
- Use the
PROC FREQprocedure to conduct the test. Example code:
PROC FREQ DATA=your_data;
  TABLES var1*var2 / CHISQ;
RUN;
This code runs a Chi Square test on the cross-tabulation of var1 and var2. The results, including the Chi Square statistic and p-value, will be displayed in the output window.
4. Using G*Power
- Open G*Power and select Chi-Square Tests from the test family menu.
- Choose the type of Chi Square test you need (e.g., goodness-of-fit, test of independence).
- Enter the effect size, alpha level, and power.
- Click Calculate to determine the required sample size or the power of your test.
5. Using NCSS
NCSS is another statistical software that provides a comprehensive set of tools for Chi Square tests.
- Load your dataset into NCSS.
- Navigate to Analysis > Proportions/Contingency Tables > Contingency Tables.
- Select your variables and set up the table.
- Run the analysis to get the Chi Square test results.
Using statistical software can make the Chi Square test process more efficient and accurate. By following these steps, you can leverage the power of these tools to analyze your categorical data effectively.
Conclusion
The Chi Square test is a versatile and powerful tool for analyzing categorical data. Its primary strength lies in its ability to determine whether there is a significant association between variables or if an observed distribution deviates from an expected distribution. However, there are important considerations and limitations to keep in mind when using this test.
- Strengths:
- Flexibility: Applicable to both tests of independence and goodness-of-fit tests.
- Non-parametric: Does not require assumptions about the underlying population distribution, making it broadly applicable.
- Ease of Use: Simple to compute and interpret, especially with the aid of statistical software.
- Limitations:
- Sample Size Requirements: The test requires a sufficiently large sample size to ensure the validity of results. Each expected frequency should be at least 5 to avoid inaccurate conclusions.
- Independence Assumption: The observations must be independent of each other. Violations of this assumption can lead to misleading results.
- Sensitivity to Small Expected Frequencies: The test can be unreliable when expected frequencies are too small, which may necessitate the use of alternative tests like Fisher's Exact Test.
In conclusion, while the Chi Square test is a robust statistical method for analyzing categorical data, careful consideration of its assumptions and limitations is essential for accurate application. Ensuring adequate sample size and independence of observations will enhance the reliability of the test outcomes. By leveraging statistical software, researchers can effectively apply the Chi Square test to draw meaningful conclusions from their data.
Cỡ mẫu tối thiểu cho kiểm định Chi-Square
READ MORE:
q33 Cỡ mẫu tối thiểu cho kiểm định Chi-Square
:max_bytes(150000):strip_icc()/Chi-SquareStatistic_Final_4199464-7eebcd71a4bf4d9ca1a88d278845e674.jpg)