Topic chi square test table example: A chi-square test is a statistical method used to examine the differences between categorical variables in a contingency table. This guide provides a detailed example of creating and interpreting a chi-square test table, helping you understand its application and significance in various fields such as research, data analysis, and academic studies.
Table of Content
Chi-Square Test Table Example
The Chi-Square Test is a statistical method used to determine if there is a significant association between two categorical variables. Below, we demonstrate the process of conducting a Chi-Square Test with an example.
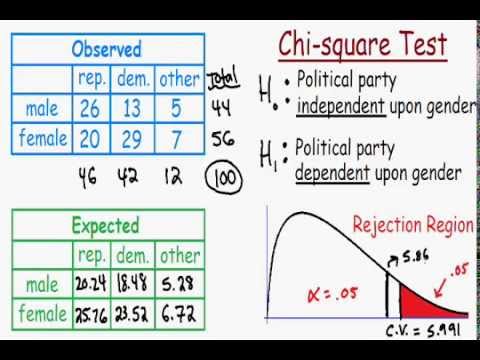
Example: Gender and Political Party Preference
Suppose we want to test if there is a link between gender and political party preference using the Chi-Square Test. We have the following observed data:
| Republican | Democrat | Independent | Total | |
|---|---|---|---|---|
| Male | 120 | 80 | 40 | 240 |
| Female | 150 | 90 | 30 | 270 |
| Total | 270 | 170 | 70 | 510 |
Calculating Expected Frequencies
The expected frequency for each cell is calculated using the formula:
$$ E_{ij} = \frac{(Row\ Total \times Column\ Total)}{Grand\ Total} $$
For example, the expected frequency for males who are Republicans is:
$$ E_{11} = \frac{(240 \times 270)}{510} = 127.06 $$
Similarly, we calculate the expected frequencies for all cells:
| Republican | Democrat | Independent | |
|---|---|---|---|
| Male | 127.06 | 80.00 | 32.94 |
| Female | 142.94 | 90.00 | 37.06 |
Chi-Square Test Statistic
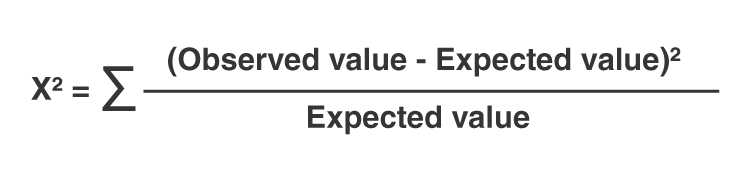
The Chi-Square statistic is calculated using the formula:
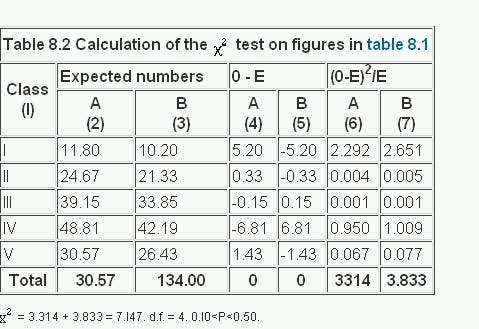
$$ \chi^2 = \sum \frac{(O_{ij} - E_{ij})^2}{E_{ij}} $$
For our example, the Chi-Square statistic is:
$$ \chi^2 = \frac{(120 - 127.06)^2}{127.06} + \frac{(80 - 80.00)^2}{80.00} + \cdots = 3.47 $$
Degrees of Freedom and Critical Value
The degrees of freedom (df) for the test is calculated as:
$$ df = (r - 1) \times (c - 1) $$
For our 2x3 table, \( df = (2 - 1) \times (3 - 1) = 2 \). Using a Chi-Square table, the critical value at a 0.05 significance level and 2 degrees of freedom is 5.99.
Conclusion
Since our calculated Chi-Square statistic (3.47) is less than the critical value (5.99), we fail to reject the null hypothesis. Therefore, there is not enough evidence to suggest an association between gender and political party preference at the 0.05 significance level.
This example demonstrates how to use the Chi-Square Test to analyze the relationship between categorical variables, calculate expected frequencies, and interpret the results based on the critical value.
READ MORE:
Introduction to Chi-Square Test
The Chi-Square test is a statistical method used to determine if there is a significant association between categorical variables. It compares the observed frequencies in each category to the frequencies that would be expected if there were no association between the variables. The test is widely used in various fields, such as social sciences, biology, and marketing, to test hypotheses about relationships between categorical data.
The Chi-Square test comes in two main types:
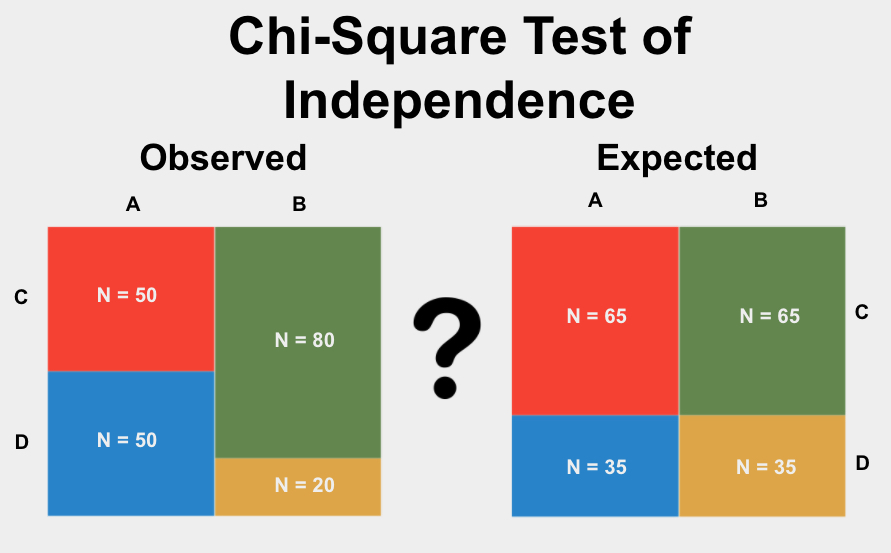
- Chi-Square Test of Independence
- Chi-Square Goodness of Fit Test
Here, we will focus on the Chi-Square Test of Independence, which examines whether two categorical variables are independent of each other. The steps involved in performing this test are as follows:
- Formulate the hypotheses:
- Null Hypothesis (H0): The variables are independent.
- Alternative Hypothesis (H1): The variables are not independent.
- Calculate the expected frequencies for each cell in the contingency table using the formula:
\[ \text{Expected Frequency} = \frac{(\text{Row Total} \times \text{Column Total})}{\text{Grand Total}} \]
- Compute the Chi-Square statistic using the formula:
\[ \chi^2 = \sum \frac{(O_i - E_i)^2}{E_i} \]where \(O_i\) is the observed frequency and \(E_i\) is the expected frequency.
- Determine the degrees of freedom (df) using the formula:
\[ df = (r - 1) \times (c - 1) \]where \(r\) is the number of rows and \(c\) is the number of columns.
- Compare the Chi-Square statistic to the critical value from the Chi-Square distribution table. If the calculated statistic is greater than the critical value, reject the null hypothesis.
The Chi-Square Test of Independence is a powerful tool for analyzing categorical data and identifying potential associations between variables. By following these steps, researchers can draw meaningful conclusions about their data and support their hypotheses with statistical evidence.
Types of Chi-Square Tests
The chi-square test is a statistical method used to determine if there is a significant association between categorical variables. There are several types of chi-square tests, each serving different purposes:
- Chi-Square Test for Independence
- Chi-Square Test for Goodness of Fit
- Chi-Square Test for Homogeneity
This test determines if there is a significant association between two categorical variables. For example, it can be used to examine if gender is related to voting preference.
This test checks if a sample data matches a population with a specific distribution. For instance, a shop owner might want to test if the distribution of customers visiting on different days matches the expected pattern.
This test compares the distribution of a categorical variable across different populations. For example, it can be used to compare the effectiveness of different training programs on the pass rate of a shooting test among basketball players.
The calculations for these tests involve comparing the observed frequencies with the expected frequencies, which are calculated based on the null hypothesis of no association. The test statistic is computed using the formula:
\[ \chi^2 = \sum \frac{(O_i - E_i)^2}{E_i} \]
Where \( O_i \) is the observed frequency and \( E_i \) is the expected frequency. The resulting test statistic is then compared to a critical value from the chi-square distribution table, considering the degrees of freedom and the significance level.
Steps to Perform a Chi-Square Test
The Chi-Square Test is a statistical method used to determine if there is a significant association between categorical variables. Here are the detailed steps to perform a Chi-Square Test:
-
Formulate the Hypotheses:
- Null Hypothesis (H0): Assumes no association between the variables.
- Alternative Hypothesis (HA): Assumes an association between the variables.
-
Construct a Contingency Table: Create a table that summarizes the frequency of occurrences of the variables.
Category 1 Category 2 ...Category k Total Group 1 O11 O12 ...O1k Row Total Group 2 O21 O22 ...O2k Row Total ... ... ... ... ... Group n On1 On2 ...Onk Row Total Total Column Total Column Total ...Column Total Grand Total -
Calculate Expected Frequencies: Use the formula for each cell:
\[
E_{ij} = \frac{(\text{Row Total for Row } i) \times (\text{Column Total for Column } j)}{\text{Grand Total}}
\] -
Compute the Chi-Square Statistic: Use the formula:
\[
X^2 = \sum \frac{(O_{ij} - E_{ij})^2}{E_{ij}}
\] -
Determine the Degrees of Freedom: Calculate as follows:
\[
\text{Degrees of Freedom} (df) = (r - 1) \times (c - 1)
\]
where \( r \) is the number of rows and \( c \) is the number of columns. -
Find the Critical Value and Compare: Use a Chi-Square distribution table or software to find the critical value based on the degrees of freedom and the significance level (commonly α = 0.05). Compare the calculated Chi-Square statistic to the critical value.
-
Draw Conclusions:
- If the Chi-Square statistic is greater than the critical value, reject the null hypothesis.
- If the Chi-Square statistic is less than or equal to the critical value, do not reject the null hypothesis.
Example Calculation
Let's go through an example calculation of a Chi-Square test to understand the process better. We will use a simple dataset to demonstrate each step.
Consider a survey of 200 people about their preference for two types of products, A and B, with the following results:
- 80 men preferred Product A
- 40 men preferred Product B
- 30 women preferred Product A
- 50 women preferred Product B
We will perform a Chi-Square test to determine if there is a significant association between gender and product preference.
- State the hypotheses:
- Null hypothesis (\(H_0\)): Gender and product preference are independent.
- Alternative hypothesis (\(H_1\)): Gender and product preference are not independent.
- Construct the contingency table:
Product A Product B Total Men 80 40 120 Women 30 50 80 Total 110 90 200 - Calculate the expected frequencies:
- Expected frequency for men preferring Product A: \(\dfrac{120 \times 110}{200} = 66\)
- Expected frequency for men preferring Product B: \(\dfrac{120 \times 90}{200} = 54\)
- Expected frequency for women preferring Product A: \(\dfrac{80 \times 110}{200} = 44\)
- Expected frequency for women preferring Product B: \(\dfrac{80 \times 90}{200} = 36\)
- Compute the Chi-Square statistic:
Product A Product B Men \(\dfrac{(80 - 66)^2}{66} \approx 3.15\) \(\dfrac{(40 - 54)^2}{54} \approx 3.63\) Women \(\dfrac{(30 - 44)^2}{44} \approx 4.45\) \(\dfrac{(50 - 36)^2}{36} \approx 5.44\) Total Chi-Square value: \(3.15 + 3.63 + 4.45 + 5.44 = 16.67\)
- Determine the degrees of freedom:
Degrees of freedom (df) = (number of rows - 1) * (number of columns - 1) = (2 - 1) * (2 - 1) = 1
- Compare the Chi-Square statistic to the critical value:
For df = 1 and a significance level of 0.05, the critical value from the Chi-Square distribution table is 3.841.
- Make a decision:
Since 16.67 > 3.841, we reject the null hypothesis and conclude that there is a significant association between gender and product preference.
Interpreting Results
Interpreting the results of a Chi-Square test involves comparing the calculated Chi-Square statistic to a critical value from the Chi-Square distribution table. Here are the detailed steps:
- Calculate the Chi-Square Statistic:
The formula for the Chi-Square statistic is:
$$\chi^2 = \sum \frac{(O_i - E_i)^2}{E_i}$$where \(O_i\) is the observed frequency and \(E_i\) is the expected frequency.
- Determine the Degrees of Freedom:
The degrees of freedom (df) are calculated differently depending on the type of Chi-Square test:
- Goodness of Fit Test: \(df = k - 1\), where \(k\) is the number of categories.
- Test of Independence: \(df = (r - 1) \times (c - 1)\), where \(r\) is the number of rows and \(c\) is the number of columns in the contingency table.
- Find the Critical Value:
Use the Chi-Square distribution table to find the critical value at the desired significance level (α), using the calculated degrees of freedom.
- Compare the Chi-Square Statistic to the Critical Value:
If the Chi-Square statistic is greater than the critical value, reject the null hypothesis. This indicates that there is a significant difference between the observed and expected frequencies.
If the Chi-Square statistic is less than the critical value, do not reject the null hypothesis. This suggests that any observed differences are likely due to chance.
- Calculate the p-value:
The p-value represents the probability of obtaining a Chi-Square statistic as extreme as, or more extreme than, the observed value, assuming the null hypothesis is true.
If the p-value is less than the significance level (α), reject the null hypothesis. Otherwise, do not reject the null hypothesis.
Through these steps, researchers can determine if there is enough evidence to support their hypothesis or if the observed data fits the expected distribution.
Applications of Chi-Square Test
- Understanding Genetic Linkages: Chi-square tests are pivotal in genetic research to assess whether observed genetic ratios fit expected ratios based on Mendelian inheritance.
- Evaluating Market Trends: Market researchers employ Chi-square tests to determine if consumer preferences are independent of demographic factors like age, gender, or location.
- Analyzing Medical Data: In medical studies, Chi-square tests help identify associations between risk factors (e.g., smoking) and outcomes (e.g., disease incidence).
- Ensuring Quality Control: Industries use Chi-square tests for quality assurance, such as testing whether the occurrence of defects is independent of production shifts or machinery types.
Xem video
Video "Kiểm Định Chi Bình Phương"
READ MORE:
Xem video
Video "Kiểm Định Chi cho Dữ Liệu Đếm: Tìm Giá trị p"


:max_bytes(150000):strip_icc()/Chi-SquareStatistic_Final_4199464-7eebcd71a4bf4d9ca1a88d278845e674.jpg)