Topic hypothesis of chi square test: The hypothesis of the chi-square test plays a crucial role in determining whether observed data deviates significantly from expected data. This statistical test is widely used to assess relationships between categorical variables. In this article, we will delve into the key aspects of formulating hypotheses for chi-square tests, ensuring accurate data interpretation and meaningful conclusions.
Table of Content
- Hypothesis of Chi-Square Test
- Introduction to Chi Square Test
- Types of Chi Square Tests
- Hypothesis in Chi Square Test
- Formulas and Calculations
- Chi Square Test of Independence
- Goodness of Fit Test
- When to Use Chi Square Test
- Step-by-Step Procedure
- Assumptions and Conditions
- Interpreting Results
- Examples and Applications
- Common Mistakes to Avoid
- Advanced Topics and Variations
- FAQs about Chi Square Test
- YOUTUBE:
Hypothesis of Chi-Square Test
The chi-square (χ²) test is a statistical method used to determine if there is a significant association between two categorical variables. It is widely used in hypothesis testing to evaluate whether the observed frequencies in a contingency table differ from the expected frequencies derived from a specific hypothesis.
Types of Chi-Square Tests
- Chi-Square Test of Independence: This test determines if there is a significant association between two categorical variables.
- Chi-Square Goodness of Fit Test: This test determines if a sample data matches a population with a specific distribution.
Hypotheses
The hypotheses for the chi-square test of independence are:
- Null Hypothesis (H0): The two categorical variables are independent.
- Alternative Hypothesis (H1): The two categorical variables are dependent.
Formula
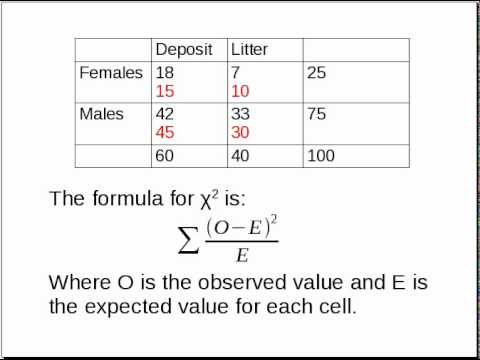
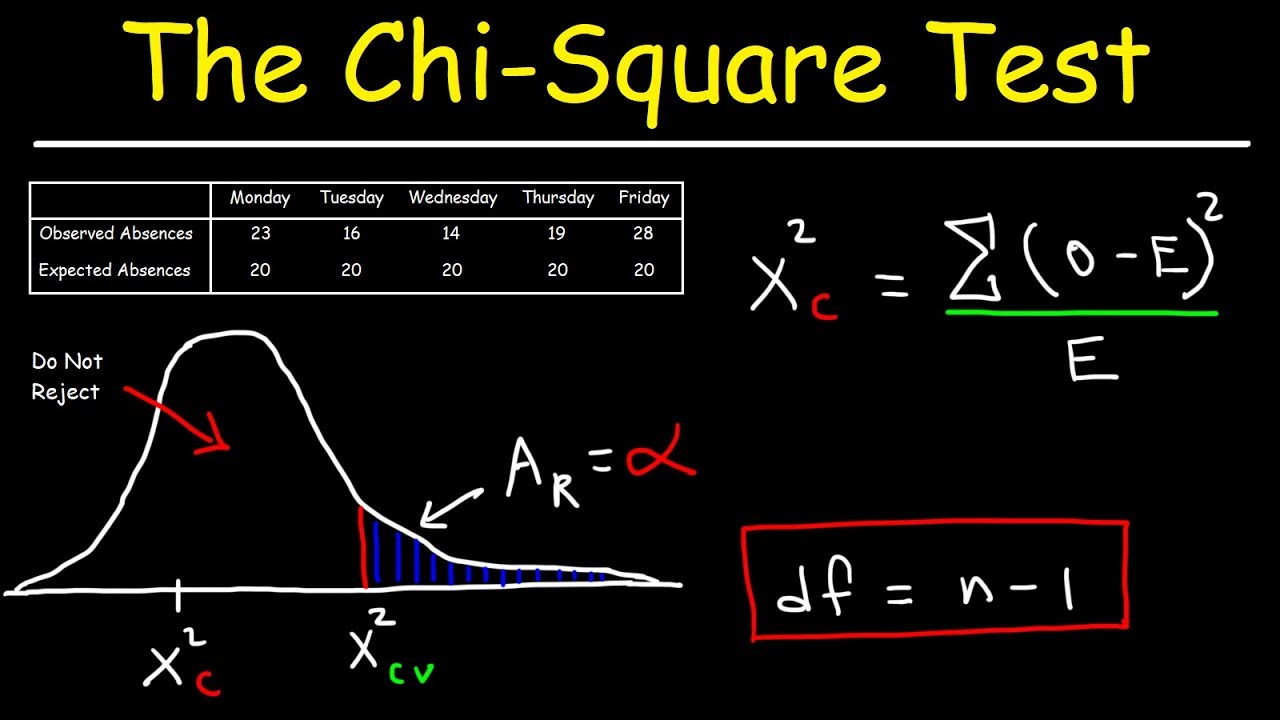
The chi-square test statistic is calculated using the formula:
\(\chi^2 = \sum \frac{(O_i - E_i)^2}{E_i}\)
Where:
- \(O_i\) = Observed frequency
- \(E_i\) = Expected frequency
Expected Frequency Calculation
The expected frequency (\(E_i\)) under the null hypothesis is calculated by:
\[E = \frac{\text{(row total)} \times \text{(column total)}}{\text{sample size}}\]
Degrees of Freedom
The degrees of freedom (df) for the chi-square test is calculated by:
\(\text{df} = (r - 1) \times (c - 1)\)
Where:
- r = number of rows
- c = number of columns
Decision Rule
Compare the calculated chi-square statistic to the critical value from the chi-square distribution table with the appropriate degrees of freedom and significance level (α). If the chi-square statistic is greater than the critical value, reject the null hypothesis.
Example
Consider a survey where a city wants to test if recycling behavior is independent of the type of intervention (flyer, phone call, or no intervention). The observed data is organized into a contingency table, and the chi-square test of independence is performed to determine if there is a significant association between the type of intervention and recycling behavior.
Contingency Table Example
| Intervention | Recycles | Does Not Recycle | Total |
|---|---|---|---|
| Flyer | 70 | 30 | 100 |
| Phone Call | 80 | 20 | 100 |
| Control | 50 | 50 | 100 |
| Total | 200 | 100 | 300 |
Using the chi-square test formula and comparing the observed and expected frequencies, we can determine if there is a significant relationship between the intervention type and recycling behavior.
:max_bytes(150000):strip_icc()/Chi-SquareStatistic_Final_4199464-7eebcd71a4bf4d9ca1a88d278845e674.jpg)
READ MORE:
Introduction to Chi Square Test
The Chi Square Test is a statistical method used to determine if there is a significant association between categorical variables. It is a nonparametric test that evaluates whether the observed frequencies in a contingency table differ from the expected frequencies derived from a null hypothesis. The test is widely used in research and analysis for its simplicity and effectiveness in handling categorical data.
To perform a Chi Square Test, follow these steps:
- Formulate the hypotheses:
- Null Hypothesis (H0): Assumes no association between the variables.
- Alternative Hypothesis (Ha): Assumes a significant association between the variables.
- Construct a contingency table with observed frequencies.
- Calculate the expected frequencies for each cell in the table using the formula:
- \(E_{ij} = \frac{(row\ total \times column\ total)}{grand\ total}\)
- Compute the Chi Square statistic using the formula:
- \(\chi^2 = \sum \frac{(O_{ij} - E_{ij})^2}{E_{ij}}\)
- Where \(O_{ij}\) is the observed frequency and \(E_{ij}\) is the expected frequency.
- Determine the degrees of freedom (\(df\)) as:
- \(df = (number\ of\ rows - 1) \times (number\ of\ columns - 1)\)
- Compare the calculated Chi Square statistic to the critical value from the Chi Square distribution table at a chosen significance level (e.g., 0.05). If the statistic exceeds the critical value, reject the null hypothesis.
The Chi Square Test is versatile and can be used for various types of categorical data analysis, including tests of independence and goodness-of-fit tests. It is essential to ensure that the data meet the test assumptions, such as having a sufficiently large sample size to avoid inaccurate results.
Types of Chi Square Tests
Chi Square tests are statistical procedures used to determine whether there is a significant association between categorical variables. There are primarily three types of Chi Square tests:
- Pearson's Chi Square Test: This test assesses the degree of association between two categorical variables measured on a nominal scale. It is commonly used for testing independence in contingency tables.
- Chi Square Test of Independence: Similar to Pearson's Chi Square Test, this test examines whether there is a relationship between two categorical variables, but without assuming any specific direction of the relationship.
- Chi Square Goodness of Fit Test: This test evaluates how well the observed categorical data fit an expected distribution. It is used to compare the observed frequencies of different categories to the expected frequencies.
Each type of Chi Square test serves a specific purpose in analyzing categorical data, helping researchers and analysts draw conclusions about the relationships and distributions within their datasets.
Hypothesis in Chi Square Test
In the context of Chi Square tests, hypotheses are formulated to assess the relationships between categorical variables. The hypotheses typically used are:
- Null Hypothesis (H0): There is no significant relationship between the categorical variables being studied.
- Alternative Hypothesis (H1): There is a significant relationship between the categorical variables being studied.
The formulation of these hypotheses depends on the specific Chi Square test being conducted:
- Pearson's Chi Square Test: H0 assumes that there is no association between the variables, while H1 assumes that there is an association.
- Chi Square Test of Independence: H0 states that the variables are independent, whereas H1 states that there is a dependency between them.
- Chi Square Goodness of Fit Test: H0 posits that the observed frequencies fit the expected distribution, whereas H1 suggests that they do not.
These hypotheses guide the statistical analysis and interpretation of Chi Square tests, helping to draw conclusions about the relationships among categorical data.
Formulas and Calculations
Formulas and calculations for Chi Square tests vary depending on the specific test being performed:
- Pearson's Chi Square Test:
Formula:
\[
\chi^2 = \sum \frac{(O_i - E_i)^2}{E_i}
\]
where \( O_i \) is the observed frequency and \( E_i \) is the expected frequency for each category. - Chi Square Test of Independence:
Formula:
\[
\chi^2 = \sum \frac{(O_{ij} - E_{ij})^2}{E_{ij}}
\]
where \( O_{ij} \) is the observed frequency in the i-th row and j-th column, and \( E_{ij} \) is the expected frequency under the assumption of independence. - Chi Square Goodness of Fit Test:
Formula:
\[
\chi^2 = \sum \frac{(O_i - E_i)^2}{E_i}
\]
where \( O_i \) is the observed frequency and \( E_i \) is the expected frequency for each category based on the hypothesized distribution.
Calculations involve computing the Chi Square statistic using the above formulas and comparing it to the critical Chi Square value from the Chi Square distribution to determine statistical significance.
Chi Square Test of Independence
The Chi Square Test of Independence is a statistical test used to determine whether there is a significant association between two categorical variables.
The steps involved in conducting this test are as follows:
- Formulate Hypotheses: Define the null hypothesis (H0) and alternative hypothesis (H1) regarding the independence of the variables.
- Construct a Contingency Table: Tabulate the observed frequencies for each combination of the categorical variables.
- Calculate Expected Frequencies: Determine the expected frequencies under the assumption that the variables are independent.
- Compute the Chi Square Statistic: Use the formula \[ \chi^2 = \sum \frac{(O_{ij} - E_{ij})^2}{E_{ij}} \] to calculate the Chi Square statistic, where \( O_{ij} \) is the observed frequency and \( E_{ij} \) is the expected frequency.
- Determine Degrees of Freedom: Degrees of freedom are calculated based on the dimensions of the contingency table.
- Compare with Critical Value: Refer to the Chi Square distribution table to find the critical value corresponding to the chosen significance level and degrees of freedom.
- Draw Conclusion: Compare the calculated Chi Square statistic with the critical value. If the calculated Chi Square statistic is greater than the critical value, reject the null hypothesis and conclude that there is a significant relationship between the variables.
The Chi Square Test of Independence is widely used in various fields to analyze relationships between categorical variables and to make informed decisions based on statistical evidence.
Goodness of Fit Test
The Goodness of Fit Test (Chi Square Test) is a statistical test used to determine how well categorical data fit an expected distribution or model.
The process for conducting a Goodness of Fit Test typically involves the following steps:
- Formulate Hypotheses: Define the null hypothesis (H0) and alternative hypothesis (H1) regarding the fit of the observed data to the expected distribution.
- Specify Expected Frequencies: Determine the expected frequencies for each category under the hypothesized distribution.
- Calculate the Chi Square Statistic: Use the formula \[ \chi^2 = \sum \frac{(O_i - E_i)^2}{E_i} \] where \( O_i \) is the observed frequency and \( E_i \) is the expected frequency for each category.
- Determine Degrees of Freedom: Degrees of freedom are determined based on the number of categories minus one.
- Compare with Critical Value: Consult the Chi Square distribution table to find the critical value corresponding to the chosen significance level and degrees of freedom.
- Draw Conclusion: Compare the calculated Chi Square statistic with the critical value. If the calculated Chi Square statistic exceeds the critical value, reject the null hypothesis and conclude that the observed data do not fit the expected distribution.
The Goodness of Fit Test is applied in various fields, such as biology, economics, and social sciences, to assess whether observed categorical data conform to theoretical expectations or models.
When to Use Chi Square Test
The Chi Square test is appropriate to use in various situations where categorical data is involved and the researcher wants to assess relationships, differences, or goodness of fit:
- Testing Independence: To determine if there is a relationship between two categorical variables.
- Comparing Groups: When comparing observed frequencies of categorical data across different groups or conditions.
- Goodness of Fit: To assess whether observed data fit a specific theoretical distribution or model.
- Frequency Distribution: Analyzing how categorical data are distributed across different categories.
- Hypothesis Testing: When conducting hypothesis tests involving categorical variables.
These scenarios illustrate the versatility of the Chi Square test in analyzing categorical data and making statistical inferences about relationships and distributions.
Step-by-Step Procedure
- Define Hypotheses: Formulate the null hypothesis (H0) and alternative hypothesis (H1) regarding the relationship between categorical variables.
- Data Collection: Gather categorical data that are relevant to the variables of interest.
- Create Contingency Table: Organize the data into a contingency table that shows the frequencies of each combination of categories.
- Calculate Expected Frequencies: Compute the expected frequencies assuming independence or a specified distribution.
- Compute Chi Square Statistic: Use the formula \[ \chi^2 = \sum \frac{(O_{ij} - E_{ij})^2}{E_{ij}} \] to calculate the Chi Square statistic, where \( O_{ij} \) is the observed frequency and \( E_{ij} \) is the expected frequency.
- Determine Degrees of Freedom: Calculate degrees of freedom based on the dimensions of the contingency table.
- Consult Chi Square Table: Refer to the Chi Square distribution table to find the critical value corresponding to the chosen significance level and degrees of freedom.
- Compare and Interpret Results: Compare the calculated Chi Square statistic with the critical value. If the calculated statistic is greater than the critical value, reject the null hypothesis and conclude there is a significant relationship.
The step-by-step procedure ensures a systematic approach to conducting Chi Square tests and interpreting the results to make informed statistical conclusions.
Assumptions and Conditions
When conducting Chi Square tests, certain assumptions and conditions should be considered:
- Independence of Observations: Each observation should be independent of the others.
- Sample Size: The sample size should be sufficiently large. A common guideline is that all expected frequencies should be greater than 5.
- Categorical Data: The data should be categorical, meaning each observation falls into one of several categories.
- Expected Frequencies: The expected frequencies should not be too small (typically greater than 1) to ensure the Chi Square approximation is valid.
- Validity of Hypotheses: The hypotheses should be clearly defined and relevant to the research question.
These assumptions and conditions help ensure the validity and reliability of Chi Square test results when analyzing categorical data.
Interpreting Results
Interpreting the results of a Chi Square test involves several key steps:
- Compare Chi Square Statistic: Review the calculated Chi Square statistic obtained from the test.
- Consult Critical Value: Refer to the Chi Square distribution table to find the critical value corresponding to the chosen significance level and degrees of freedom.
- Compare Values: Compare the calculated Chi Square statistic with the critical value.
- Draw Conclusion: If the calculated Chi Square statistic is greater than the critical value, reject the null hypothesis and conclude that there is a significant relationship or difference.
- Consider Practical Significance: Evaluate the practical importance or meaningfulness of the results beyond statistical significance.
- Report Findings: Clearly communicate the findings, including the Chi Square statistic, degrees of freedom, p-value (if available), and conclusion about the relationship between variables.
Interpreting Chi Square test results accurately is crucial for drawing valid conclusions from categorical data analyses.
Examples and Applications
The Chi-Square Test is widely used in various fields to determine if there is a significant association between categorical variables. Here are some detailed examples and applications:
1. Chi-Square Test of Independence Example
Consider a city aiming to increase recycling among its residents. The city implements two interventions: an educational flyer and a phone call. They randomly select 300 households and assign them to one of three groups: flyer, phone call, or control (no intervention). After six months, the outcomes (whether households recycle or not) are recorded as follows:
| Intervention | Recycles | Does not recycle | Row totals |
|---|---|---|---|
| Flyer | 89 | 9 | 98 |
| Phone call | 84 | 8 | 92 |
| Control | 86 | 24 | 110 |
| Column totals | 259 | 41 | 300 |
To analyze whether the intervention type is associated with recycling behavior, we perform a Chi-Square Test of Independence using the observed frequencies.
2. Goodness-of-Fit Test Example
Imagine a dice manufacturer wants to test whether their dice are fair. They roll a die 60 times and record the frequency of each face:
- Face 1: 8 times
- Face 2: 10 times
- Face 3: 9 times
- Face 4: 12 times
- Face 5: 11 times
- Face 6: 10 times
To determine if the die is fair, we compare the observed frequencies to the expected frequencies (which should be 10 times for each face if the die is fair) using the Chi-Square Goodness-of-Fit Test.
3. Application in Marketing
A company wants to know if customer preference for a product is associated with gender. They conduct a survey with the following results:
| Product | Male | Female |
|---|---|---|
| Product A | 30 | 50 |
| Product B | 70 | 40 |
The Chi-Square Test of Independence can be used to determine if there is a significant association between product preference and gender.
4. Medical Research
Researchers study the effectiveness of a new drug. They categorize patients as either recovered or not recovered after treatment and compare these outcomes across different dosages:
| Dosage | Recovered | Not recovered |
|---|---|---|
| Low | 25 | 35 |
| Medium | 40 | 20 |
| High | 30 | 10 |
Using the Chi-Square Test, researchers can assess if the recovery rate is significantly associated with the drug dosage.
These examples illustrate the versatility of the Chi-Square Test in different domains, providing a powerful tool to analyze categorical data and uncover significant associations.
Common Mistakes to Avoid
When conducting a Chi-Square test, it's essential to be aware of common pitfalls to ensure accurate results and interpretations. Here are some key mistakes to avoid:
- Using Non-Categorical Data: The Chi-Square test is designed for categorical data. Applying it to continuous data can lead to incorrect conclusions. Ensure your data is appropriately categorized.
- Small Sample Sizes: The expected frequency in each cell of your contingency table should ideally be 5 or more. Small sample sizes can lead to unreliable results and increase the risk of Type I and Type II errors.
- Ignoring Assumptions: The Chi-Square test assumes that the data are a random sample from the population and that each observation is independent. Violating these assumptions can invalidate your test results.
- Misinterpreting P-Values: A significant p-value indicates that the observed data are unlikely under the null hypothesis, but it does not measure the strength or importance of an effect. Always consider the practical significance alongside the statistical significance.
- Overlooking Effect Size: In addition to the Chi-Square statistic, it’s important to report effect size measures, such as Cramer's V or the Phi coefficient, to understand the strength of the association between variables.
- Post-Hoc Analysis Misuse: If your Chi-Square test is significant, use post-hoc analysis to identify which categories are driving the result. Applying corrections like the Bonferroni correction can help control for multiple comparisons.
By avoiding these common mistakes, you can improve the reliability and validity of your Chi-Square test results.

Advanced Topics and Variations
The Chi-Square Test is a versatile tool in statistical analysis, and understanding its advanced applications and variations can significantly enhance its utility. Below are some key advanced topics and variations:
1. Yates' Continuity Correction
Yates' continuity correction is applied to the Chi-Square Test of Independence to adjust for the bias introduced by using a continuous distribution to approximate a discrete distribution, particularly useful for 2x2 tables.
- The corrected formula is: \[ \chi^2 = \sum \frac{(|O_i - E_i| - 0.5)^2}{E_i} \]
- This correction reduces the Chi-Square value, making it less likely to reject the null hypothesis, especially with small sample sizes.
2. Fisher's Exact Test
For small sample sizes or when the expected frequency in any cell is less than 5, Fisher's Exact Test is an alternative to the Chi-Square Test of Independence. It is more accurate and does not rely on large sample approximations.
- Unlike the Chi-Square Test, Fisher's Exact Test calculates an exact p-value.
3. Likelihood Ratio Chi-Square Test
The Likelihood Ratio Chi-Square Test, also known as G-Test, is another alternative that compares the likelihood of the observed data under the null and alternative hypotheses.
- The test statistic is given by: \[ G = 2 \sum O_i \ln\left(\frac{O_i}{E_i}\right) \]
- This test is particularly useful when dealing with log-linear models or larger contingency tables.
4. Mantel-Haenszel Chi-Square Test
This test is used to analyze stratified or matched data, adjusting for confounding variables. It is particularly useful in epidemiological studies.
- The Mantel-Haenszel test provides an adjusted odds ratio for the association between exposure and outcome, controlling for stratifying variables.
5. Bayesian Chi-Square Test
A Bayesian approach to the Chi-Square Test incorporates prior knowledge or beliefs into the analysis, offering a probabilistic interpretation of the results.
- This approach calculates the posterior distribution of the test statistic, providing a more nuanced understanding of the data.
6. Effect Size Measures
While the Chi-Square Test indicates whether there is an association between variables, it does not measure the strength of this association. Effect size measures such as Cramer's V or Phi coefficient provide additional insight.
- Cramer's V is calculated as: \[ V = \sqrt{\frac{\chi^2}{n \times (\min(k-1, r-1))}} \]
- Where \(\chi^2\) is the Chi-Square statistic, \(n\) is the sample size, \(k\) is the number of columns, and \(r\) is the number of rows.
7. Log-Linear Models
Log-linear models are an extension of the Chi-Square Test used for multi-way tables to examine the relationship between more than two categorical variables simultaneously.
- These models use the natural logarithm of expected cell frequencies and offer a way to test complex interactions between variables.
Conclusion
Advanced topics and variations of the Chi-Square Test allow for more nuanced and accurate analyses, especially in complex or specialized scenarios. Understanding and applying these methods can greatly enhance the robustness and interpretability of statistical findings.
FAQs about Chi Square Test
Q1: What is the Chi-Square Test of Independence?
A Chi-Square Test of Independence is a statistical test used to determine if there is a significant association between two categorical variables.
Q2: What type of data is suitable for the Chi-Square Test?
The test is suitable for categorical or nominal variables.
Q3: Can Chi-Square Test establish causality between variables?
No, the test can only indicate an association, not a causal relationship.
Q4: What are the assumptions for the Chi-Square Test?
The test assumes that the data is a random sample from a larger population and that the observations are mutually exclusive and exhaustive.
Q5: What is the Chi-Square statistic?
The Chi-Square statistic measures the discrepancy between observed and expected data, calculated using the formula: \( \chi^2 = \sum \frac{(O_i - E_i)^2}{E_i} \), where \( O_i \) is the observed frequency and \( E_i \) is the expected frequency.
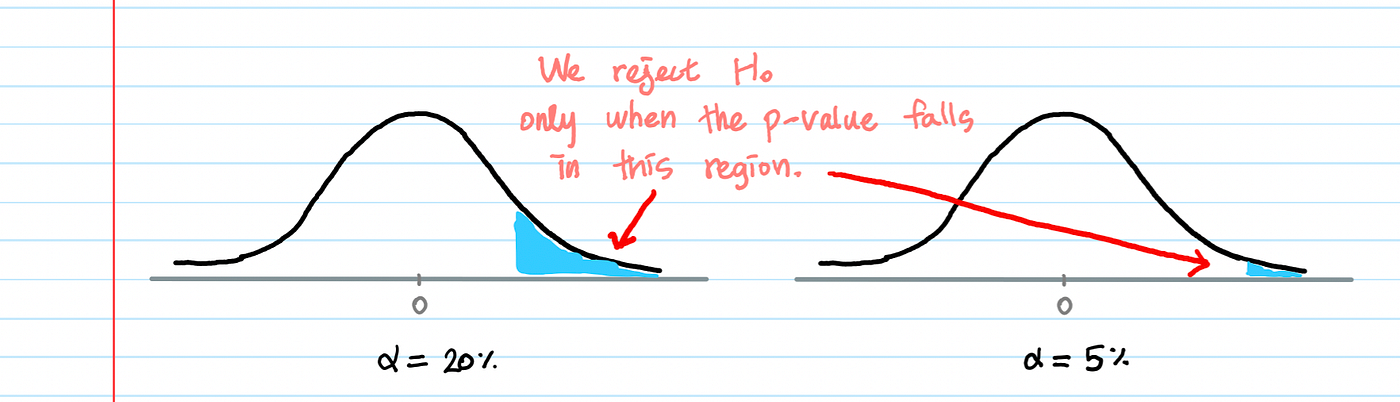
Q6: How is statistical significance determined in the Chi-Square Test?
Statistical significance is determined by comparing the test statistic to a critical value from the Chi-Square distribution table. A result is considered significant if the p-value is less than the chosen significance level (commonly 0.05).
Q7: What happens if the Chi-Square Test is used on inappropriate data types?
Using the Chi-Square Test on continuous or ordinal data without appropriate categorization can lead to misleading results.
Q8: How do small sample sizes impact the Chi-Square Test?
Small sample sizes can distort the test results, especially if the expected frequency in any cell is less than 5, potentially leading to Type I or Type II errors.
Q9: What are the potential errors with the Chi-Square Test?
Low expected cell frequencies can result in Type I errors (false positives) or Type II errors (false negatives).
Q10: How can one interpret the results of the Chi-Square Test?
Interpret the results in the context of the research question and hypothesis, considering both statistical significance and practical significance. It’s important to understand the broader theoretical implications of the findings.
Chi-square statistic for hypothesis testing | AP Statistics | Khan Academy