Topic example of chi square test for independence: Explore an example of the Chi-Square Test for Independence in action. This statistical method assesses the relationship between categorical variables, determining whether observed associations are statistically significant. Learn how to interpret results and apply this test in practical scenarios.
Table of Content
- Example of Chi-Square Test for Independence
- Introduction to Chi-Square Test for Independence
- When to Use the Chi-Square Test for Independence
- Steps to Perform Chi-Square Test for Independence
- Hypothesis Testing
- Calculating the Chi-Square Test Statistic
- Example of Chi-Square Test for Independence
- Interpreting the Results
- YOUTUBE: Xem video này để hiểu về Kiểm Định Chi Bình Phương và cách áp dụng nó trong phân tích các mẫu về sự độc lập giữa các biến phân loại.
Example of Chi-Square Test for Independence
The Chi-Square Test for Independence is a statistical test used to determine if there is a significant association between two categorical variables. Below is a detailed example illustrating how to perform this test.
Step-by-Step Example
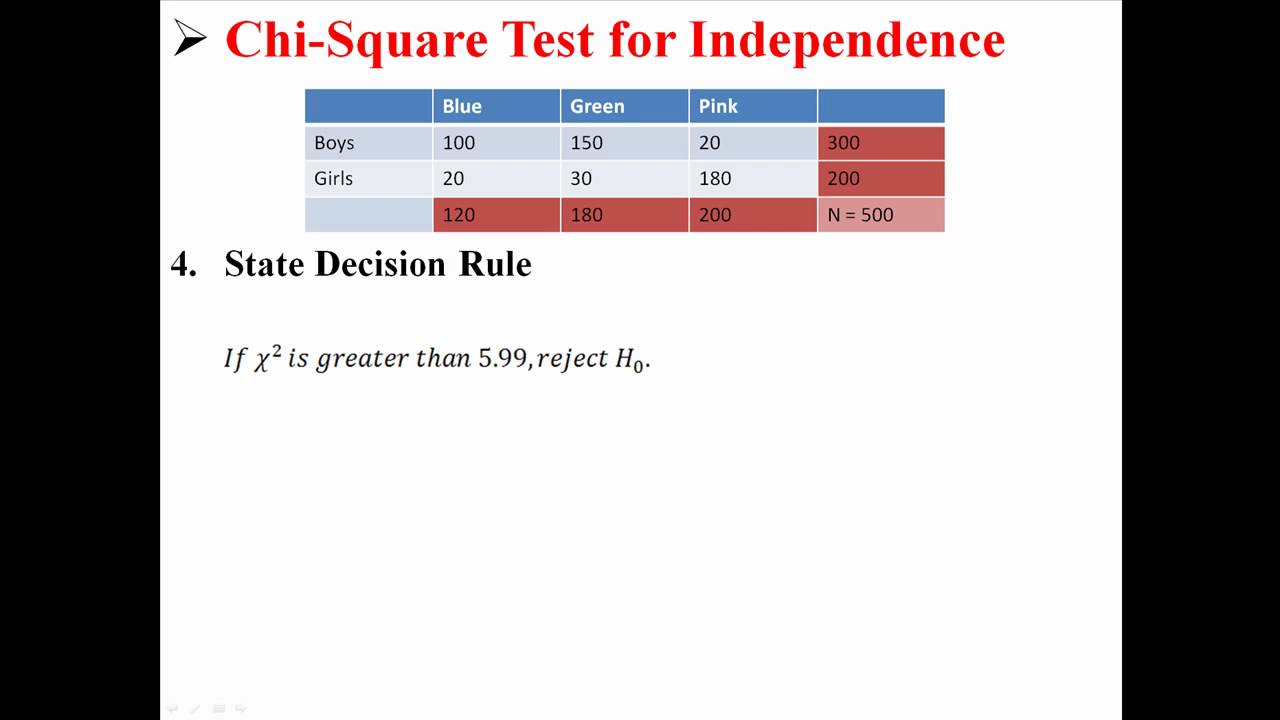
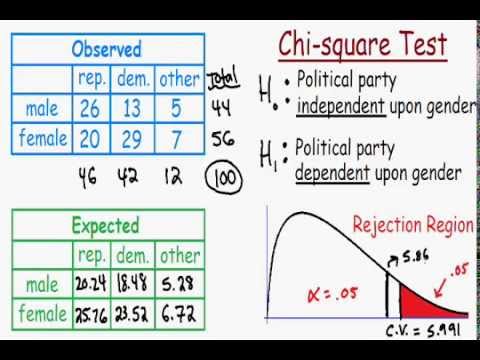
Suppose we want to determine if gender is associated with political party preference. We take a random sample of 500 voters and classify their responses into the following contingency table:
| Republican | Democrat | Independent | Total | |
|---|---|---|---|---|
| Male | 120 | 90 | 40 | 250 |
| Female | 110 | 95 | 45 | 250 |
| Total | 230 | 185 | 85 | 500 |
Step 1: Define the Hypotheses
- Null Hypothesis (\(H_0\)): Gender and political party preference are independent.
- Alternative Hypothesis (\(H_1\)): Gender and political party preference are not independent.
Step 2: Calculate the Expected Values
The expected value for each cell is calculated using the formula:
\[ \text{Expected value} = \frac{\text{Row total} \times \text{Column total}}{\text{Grand total}} \]
| Republican | Democrat | Independent | Total | |
|---|---|---|---|---|
| Male | 115 | 92.5 | 42.5 | 250 |
| Female | 115 | 92.5 | 42.5 | 250 |
| Total | 230 | 185 | 85 | 500 |
Step 3: Calculate the Chi-Square Statistic
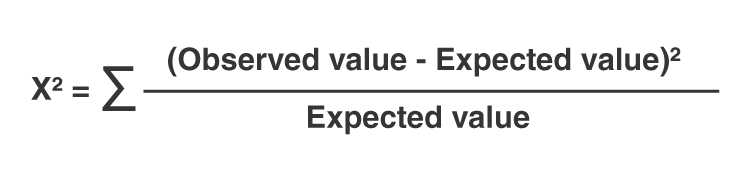
We calculate the Chi-Square statistic using the formula:
\[ \chi^2 = \sum \frac{(O - E)^2}{E} \]
Where \( O \) is the observed frequency and \( E \) is the expected frequency.
For each cell:
| Republican | Democrat | Independent | |
|---|---|---|---|
| Male | 0.2174 | 0.0676 | 0.1471 |
| Female | 0.2174 | 0.0676 | 0.1471 |
Total Chi-Square statistic:
\[ \chi^2 = 0.2174 + 0.0676 + 0.1471 + 0.2174 + 0.0676 + 0.1471 = 0.8642 \]
Step 4: Determine the P-value
Using a Chi-Square distribution table or calculator, find the p-value associated with the test statistic \(\chi^2\) and the degrees of freedom:
Degrees of freedom \(df = (2-1)(3-1) = 2\)
P-value for \(\chi^2 = 0.8642\) and \(df = 2\) is approximately 0.649.
Step 5: Draw a Conclusion
Since the p-value (0.649) is greater than the significance level (0.05), we fail to reject the null hypothesis. There is insufficient evidence to conclude that gender and political party preference are associated.
Conclusion
The Chi-Square Test for Independence is a useful statistical tool for determining if there is a significant relationship between two categorical variables. In this example, we found no significant association between gender and political party preference.

READ MORE:
Introduction to Chi-Square Test for Independence
The Chi-Square Test for Independence is a statistical method used to determine if there is a significant association between two categorical variables. It compares the observed frequencies in each category to the frequencies we might expect by chance.
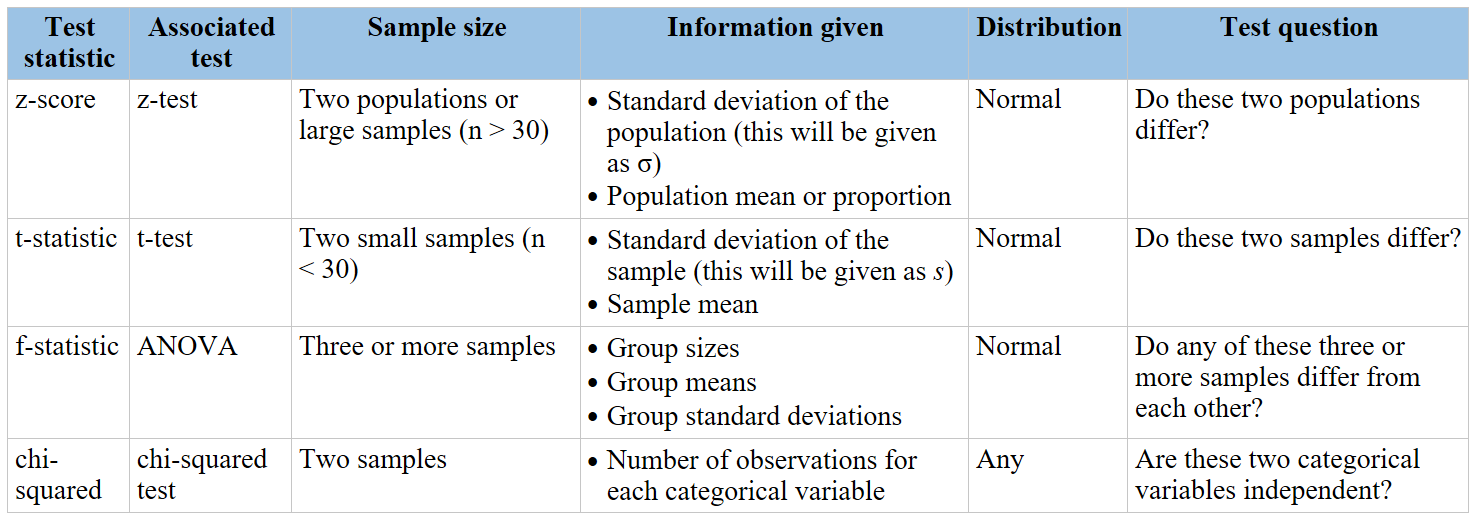
When to Use the Chi-Square Test for Independence
Knowing when to employ the Chi-Square Test for Independence is crucial. This statistical test is suitable when analyzing two categorical variables from the same population. It helps determine whether there exists a significant association between the variables under investigation, providing insights into relationships that might otherwise appear coincidental.
Steps to Perform Chi-Square Test for Independence
Executing the Chi-Square Test for Independence involves several systematic steps:
State the hypotheses: Define the null hypothesis (H0) assuming independence and the alternative hypothesis (H1) suggesting dependence between the variables.
Formulate an analysis plan: Decide on the significance level (typically 0.05) and the type of test (one-tailed or two-tailed).
Analyze sample data: Collect categorical data and organize it into a contingency table.
Interpret results: Calculate the chi-square test statistic using the formula \( \chi^2 = \sum \frac{(O_i - E_i)^2}{E_i} \), determine degrees of freedom, and compare the obtained chi-square value to critical values from the chi-square distribution to find the p-value.
Hypothesis Testing
In hypothesis testing for the Chi-Square Test for Independence:
Establish the null hypothesis (H0) assuming no association between the categorical variables.
Formulate the alternative hypothesis (H1) suggesting there is a significant association between the variables.
Calculate the chi-square test statistic to quantify the difference between observed and expected frequencies.
Determine the degrees of freedom based on the contingency table dimensions.
Evaluate the computed p-value against the chosen significance level (e.g., 0.05) to decide whether to reject the null hypothesis.
Calculating the Chi-Square Test Statistic
Compute the chi-square test statistic using these steps:
Calculate expected frequencies: For each cell in the contingency table, determine the expected frequency \( E_i \).
Use the formula: \( \chi^2 = \sum \frac{(O_i - E_i)^2}{E_i} \), where \( O_i \) is the observed frequency and \( E_i \) is the expected frequency.
Determine degrees of freedom: Compute using \( (R - 1) \times (C - 1) \), where \( R \) is the number of rows and \( C \) is the number of columns in the contingency table.
Compare to chi-square distribution: Find the p-value by comparing the calculated chi-square value to critical values from the chi-square distribution table with the degrees of freedom.
Example of Chi-Square Test for Independence
Suppose we conducted a study to examine the relationship between smoking habits and exercise frequency among 300 individuals. The data collected is summarized in the following contingency table:
| Never Smoker | Occasional Smoker | Regular Smoker | Total | |
|---|---|---|---|---|
| Never Exercise | 50 | 30 | 20 | 100 |
| Exercise 1-2 times/week | 30 | 40 | 30 | 100 |
| Exercise 3+ times/week | 20 | 30 | 50 | 100 |
| Total | 100 | 100 | 100 | 300 |
From this table, we can calculate the expected frequencies and perform the chi-square test to determine if there is a significant association between smoking habits and exercise frequency.
Interpreting the Results
After performing the chi-square test for independence, we obtain a test statistic and a corresponding p-value. Here’s how to interpret the results:
- If the p-value is less than the chosen significance level (e.g., 0.05), we reject the null hypothesis.
- Rejecting the null hypothesis indicates that there is a significant association between the categorical variables tested.
- If the p-value is greater than the chosen significance level, we fail to reject the null hypothesis.
- Failing to reject the null hypothesis suggests that there is no significant association found between the variables.
It's important to consider the context of the study and the chosen significance level when interpreting the results of the chi-square test.
Xem video này để hiểu về Kiểm Định Chi Bình Phương và cách áp dụng nó trong phân tích các mẫu về sự độc lập giữa các biến phân loại.
Video về Kiểm Định Chi Bình Phương cho Sự Độc Lập
READ MORE:
Xem video này để tìm hiểu về phân tích sự độc lập bằng phân phối Chi-Bình Phương và cách áp dụng nó trong các ví dụ về kiểm định chi bình phương cho sự độc lập.
Phân Tích Sự Độc Lập Bằng Phân Phối Chi-Bình Phương


:max_bytes(150000):strip_icc()/Chi-SquareStatistic_Final_4199464-7eebcd71a4bf4d9ca1a88d278845e674.jpg)
