Topic chi square test one sample: Explore the fundamentals of the chi square test in one sample analysis. This article provides a clear overview of how this statistical method is used, its benefits, and practical examples. Whether you're new to statistics or brushing up on your skills, discover how to interpret results and apply chi square tests effectively in real-world scenarios.
Table of Content
- Chi-Square Test for One Sample
- Introduction to Chi Square Test One Sample
- Understanding Chi Square Test: Basic Concepts
- Applications of Chi Square Test in One Sample Analysis
- Step-by-Step Guide to Conducting Chi Square Test
- Interpreting Results from Chi Square Test
- Assumptions and Limitations of Chi Square Test
- Advantages of Using Chi Square Test in One Sample Studies
- Comparative Analysis: Chi Square Test vs. Other Statistical Tests
- Real-World Examples of Chi Square Test in One Sample Scenarios
- Common Mistakes and How to Avoid Them in Chi Square Test
- Conclusion: Summary of Key Points on Chi Square Test One Sample
- YOUTUBE:
Chi-Square Test for One Sample
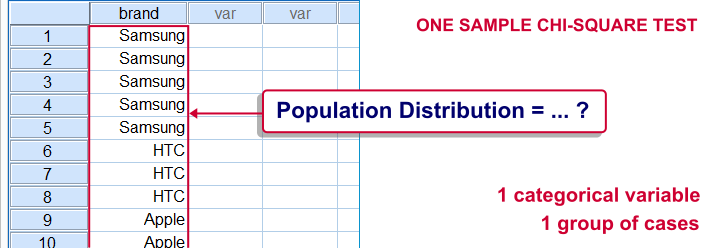
The chi-square test for one sample, also known as the chi-square goodness of fit test, is used to determine whether the observed frequencies of a single categorical variable differ significantly from the expected frequencies.
When to Use a Chi-Square Test
- To test a hypothesis about the distribution of a categorical variable
- When the sample is randomly selected from the population
- When each expected frequency is at least 5
Steps to Perform a Chi-Square Test
- Define the null and alternative hypotheses.
- Calculate the expected frequencies based on the null hypothesis.
- Use the chi-square formula to calculate the test statistic: \[ \chi^2 = \sum \frac{(O_i - E_i)^2}{E_i} \] where \( O_i \) are the observed frequencies and \( E_i \) are the expected frequencies.
- Determine the degrees of freedom: \( df = \text{number of categories} - 1 \).
- Compare the test statistic to the critical value from the chi-square distribution table.
- Make a decision: if the test statistic is greater than the critical value, reject the null hypothesis.
Example of a Chi-Square Test
Suppose we want to test if the colors of candies in a bag are evenly distributed. We have the following observed counts:
| Red | Blue | Green | Yellow | Orange |
| 20 | 30 | 25 | 15 | 10 |
If we expect an equal distribution, the expected frequency for each color would be 20 (assuming a total of 100 candies).
Reporting Results
When reporting the results of a chi-square test, include the observed frequencies, expected frequencies, the test statistic value, degrees of freedom, and the p-value. For example:
"The chi-square goodness of fit test indicated that the distribution of candy colors was not even, \( \chi^2(4) = 13.5, p = 0.009 \)."
Assumptions
- Independent observations
- None of the expected frequencies are less than 5
By following these steps and ensuring assumptions are met, the chi-square test for one sample can provide valuable insights into the distribution of categorical data.
READ MORE:
Introduction to Chi Square Test One Sample
The chi square test for one sample is a statistical method used to determine whether there is a significant association between observed and expected frequencies of categorical data within a single sample. It is particularly useful in situations where data is non-parametric and variables are categorical rather than numerical.
Key points to understand:
- The test assesses whether the observed frequencies of categorical data differ significantly from the expected frequencies.
- It is based on the chi square statistic, which measures the divergence between observed and expected values.
- Applications include testing hypotheses about the distribution of categorical variables in a single population or sample.
The process involves:
- Formulating hypotheses: Establishing null and alternative hypotheses about the expected distribution of categorical data.
- Calculating the test statistic: Using the formula \( \chi^2 = \sum \frac{(O_i - E_i)^2}{E_i} \), where \( O_i \) is the observed frequency and \( E_i \) is the expected frequency.
- Comparing with critical values: Determining the critical value from the chi square distribution table based on degrees of freedom and desired significance level.
- Interpreting results: If the calculated chi square value exceeds the critical value, the null hypothesis is rejected, indicating a significant difference between observed and expected frequencies.
Understanding the chi square test for one sample is fundamental for analyzing categorical data and drawing meaningful conclusions from statistical analyses.
Understanding Chi Square Test: Basic Concepts
The chi square test is a statistical method used to determine whether there is a significant association between observed and expected frequencies of categorical data. Here are the basic concepts:
- Observed and Expected Frequencies: The test compares the observed frequencies of categories in a dataset with the frequencies that would be expected if there were no association.
- Null Hypothesis (H0) and Alternative Hypothesis (H1): H0 assumes no association between variables, while H1 suggests there is an association.
- Chi Square Statistic: The test statistic, \( \chi^2 \), measures the discrepancy between observed and expected frequencies.
- Degree of Freedom: This parameter determines the distribution of the chi square statistic and is calculated as \( df = (r-1)(c-1) \), where \( r \) and \( c \) are the number of rows and columns in the contingency table.
- Significance Level: Typically set at 0.05, it indicates the probability of rejecting H0 when it is actually true.
Steps to perform the chi square test:
- Construct a Contingency Table: Organize data into rows and columns to display frequencies of categorical variables.
- Calculate Expected Frequencies: Based on the null hypothesis, compute the expected frequencies for each cell in the contingency table.
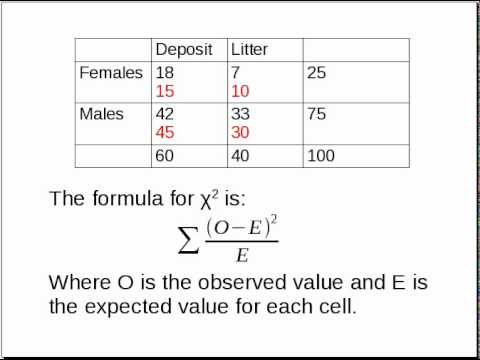
- Compute the Chi Square Statistic: Use the formula \( \chi^2 = \sum \frac{(O_i - E_i)^2}{E_i} \), where \( O_i \) is the observed frequency and \( E_i \) is the expected frequency.
- Compare with Critical Value: Determine the critical value from the chi square distribution table based on degrees of freedom and significance level.
- Interpret the Results: If the calculated chi square value exceeds the critical value, reject the null hypothesis and conclude there is a significant association between variables.
Understanding these basic concepts is essential for correctly applying and interpreting the chi square test in statistical analysis.
Applications of Chi Square Test in One Sample Analysis
The chi square test for one sample is widely used across various fields for analyzing categorical data. Here are some common applications:
- Quality Control: It assesses whether the observed defect rates in a production batch conform to expected standards.
- Market Research: Analyzing survey responses to determine if observed preferences differ significantly from expected distributions.
- Genetics: Testing genetic data to determine if observed ratios of phenotypes fit expected Mendelian ratios.
- Social Sciences: Studying demographic data to test hypotheses about population distributions and characteristics.
- Medicine: Evaluating the efficacy of a treatment by comparing observed patient outcomes with expected outcomes.
- Environmental Studies: Assessing ecological data to determine if observed frequencies of species differ from expected biodiversity models.
By applying the chi square test, researchers and analysts can determine whether there is a statistically significant difference between observed and expected frequencies in various scenarios, leading to informed decision-making and deeper insights into categorical data.
Step-by-Step Guide to Conducting Chi Square Test
Conducting a chi square test involves several key steps to ensure accurate analysis of categorical data:
- Formulate Hypotheses: Define the null hypothesis (H0) and alternative hypothesis (H1) regarding the distribution of categorical data.
- Create a Contingency Table: Organize data into rows and columns to display observed frequencies of categories.
- Calculate Expected Frequencies: Compute the expected frequencies for each cell in the contingency table based on the null hypothesis.
- Compute the Chi Square Statistic: Use the formula \( \chi^2 = \sum \frac{(O_i - E_i)^2}{E_i} \), where \( O_i \) is the observed frequency and \( E_i \) is the expected frequency.
- Determine Degrees of Freedom: Calculate degrees of freedom as \( df = (r-1)(c-1) \), where \( r \) and \( c \) are the number of rows and columns in the contingency table.
- Find the Critical Value: Refer to the chi square distribution table to find the critical value corresponding to your chosen significance level.
- Compare and Interpret: Compare the calculated chi square statistic with the critical value. If \( \chi^2 \) is greater than the critical value, reject H0 and conclude there is a significant association between variables.
Following these steps ensures a systematic approach to conducting and interpreting the chi square test, providing reliable insights into categorical data relationships.
Interpreting Results from Chi Square Test
Interpreting the results of a chi-square test involves several key steps. The chi-square test compares the observed frequencies in each category to the expected frequencies, which are calculated based on the null hypothesis. The goal is to determine whether the differences between the observed and expected frequencies are due to chance or if they are statistically significant.
- Observed Frequencies: These are the actual counts obtained from your data.
- Expected Frequencies: These are the counts that would be expected if the null hypothesis were true. They are calculated based on the proportions specified in the null hypothesis.
- Chi-Square Statistic (χ²): This value summarizes the discrepancies between the observed and expected frequencies. It is calculated using the formula:
\[
\chi^2 = \sum \frac{(O_i - E_i)^2}{E_i}
\]
where \(O_i\) is the observed frequency and \(E_i\) is the expected frequency for each category.
- Degrees of Freedom (df): This is calculated as the number of categories minus one. It is used to determine the critical value from the chi-square distribution table.
- P-value: The p-value indicates the probability of obtaining a chi-square value as extreme as, or more extreme than, the observed value, assuming the null hypothesis is true.
To interpret the results:
- Compare the Chi-Square Statistic to the Critical Value:
- Determine the degrees of freedom for your test.
- Using the chi-square distribution table, find the critical value corresponding to your degrees of freedom and the chosen significance level (e.g., 0.05).
- If your chi-square statistic is greater than the critical value, you reject the null hypothesis.
- Evaluate the P-value:
- If the p-value is less than the significance level (e.g., p < 0.05), you reject the null hypothesis.
- If the p-value is greater than the significance level, you fail to reject the null hypothesis.
In summary, if the chi-square statistic is significantly large, or if the p-value is sufficiently small, you conclude that there is a significant difference between the observed and expected frequencies. Otherwise, you conclude that any differences are likely due to random chance, and the null hypothesis cannot be rejected.
Assumptions and Limitations of Chi Square Test
The Chi-Square Test is a powerful statistical tool used to determine if there is a significant association between categorical variables. However, it comes with certain assumptions and limitations that must be considered to ensure the validity of the test results.
Assumptions
- Independence of Observations: Each observation must be independent of all others. This means the occurrence of one observation should not influence the occurrence of another.
- Categorical Data: The test is applicable only to data that can be categorized. This includes nominal or ordinal data.
- Mutually Exclusive Categories: Each observation must fall into one and only one category within the contingency table.
- Expected Frequency: The expected frequency in each cell of the contingency table should be at least 5 for the Chi-Square approximation to be valid. If this assumption is not met, it can affect the test's accuracy.
- Random Sampling: The sample data should be randomly selected from the population to avoid bias.
Limitations
- Sample Size: The Chi-Square Test is sensitive to sample size. Small sample sizes can lead to inaccurate results, while very large sample sizes can result in statistically significant outcomes that are not practically significant.
- Cell Frequency: If any cell in the contingency table has an expected frequency of less than 5, the Chi-Square Test may not be valid. In such cases, other tests like Fisher's Exact Test might be more appropriate.
- Only Indicates Association: The test only indicates whether there is an association between variables, not causation. A significant Chi-Square result does not imply that one variable causes changes in another.
- Sensitivity to Data Distribution: The test assumes a specific distribution (chi-square distribution) and may not perform well if the data does not meet this distribution requirement.
- Limited to Two-Way Tables: While extensions exist, the standard Chi-Square Test is most commonly applied to two-way tables and may not be suitable for higher-dimensional tables without modifications.
Mitigating Limitations
- Use of Alternatives: In cases where the expected cell frequency is too low, consider using alternative tests like Fisher's Exact Test.
- Effect Size Measures: Complement the Chi-Square Test with measures of effect size, such as Cramer's V or the Phi coefficient, to understand the strength of the association.
- Contextual Interpretation: Always interpret the results in the context of the research question and practical significance, not just statistical significance.
Advantages of Using Chi Square Test in One Sample Studies
The Chi-square test is a valuable tool in statistical analysis, especially for one sample studies. Here are some of the key advantages:
- Simplicity: The Chi-square test is relatively straightforward and easy to understand, making it accessible even for those new to statistics. It involves basic arithmetic operations and is simple to calculate.
- Versatility: This test can be applied to various types of categorical data, including binary, nominal, and ordinal data. It is useful for testing hypotheses about the distribution of categorical variables and can be applied in diverse fields such as biology, social sciences, and marketing.
- Non-parametric nature: The Chi-square test does not require the assumption of a normal distribution, making it applicable to data that do not meet the criteria for parametric tests. This flexibility allows it to be used with a wider range of data sets.
- Handling large datasets: The Chi-square test performs well with large datasets, providing robust and reliable results. The accuracy of the test improves as the sample size increases, making it ideal for large-scale studies.
- Good for hypothesis testing: It is particularly effective for testing hypotheses about the distribution of frequencies across different categories. It helps determine if the observed frequencies significantly differ from the expected frequencies.
- Independence testing: The Chi-square test can be used to assess the independence of two categorical variables, providing insights into whether variables are related or independent of each other.
In conclusion, the Chi-square test offers simplicity, versatility, and robustness, making it a powerful tool for analyzing categorical data in one sample studies.
Comparative Analysis: Chi Square Test vs. Other Statistical Tests
The Chi Square Test is a versatile tool in statistical analysis, primarily used to assess the association between categorical variables. However, there are several other statistical tests that are often used in similar contexts. This section provides a comparative analysis of the Chi Square Test and other common statistical tests, highlighting their differences, applications, and advantages.
Chi Square Test
The Chi Square Test is used for testing relationships between categorical variables. It is divided into two main types:
- Chi Square Goodness of Fit Test: Determines if a sample matches a population. It compares the observed frequencies to the expected frequencies derived from a specified distribution.
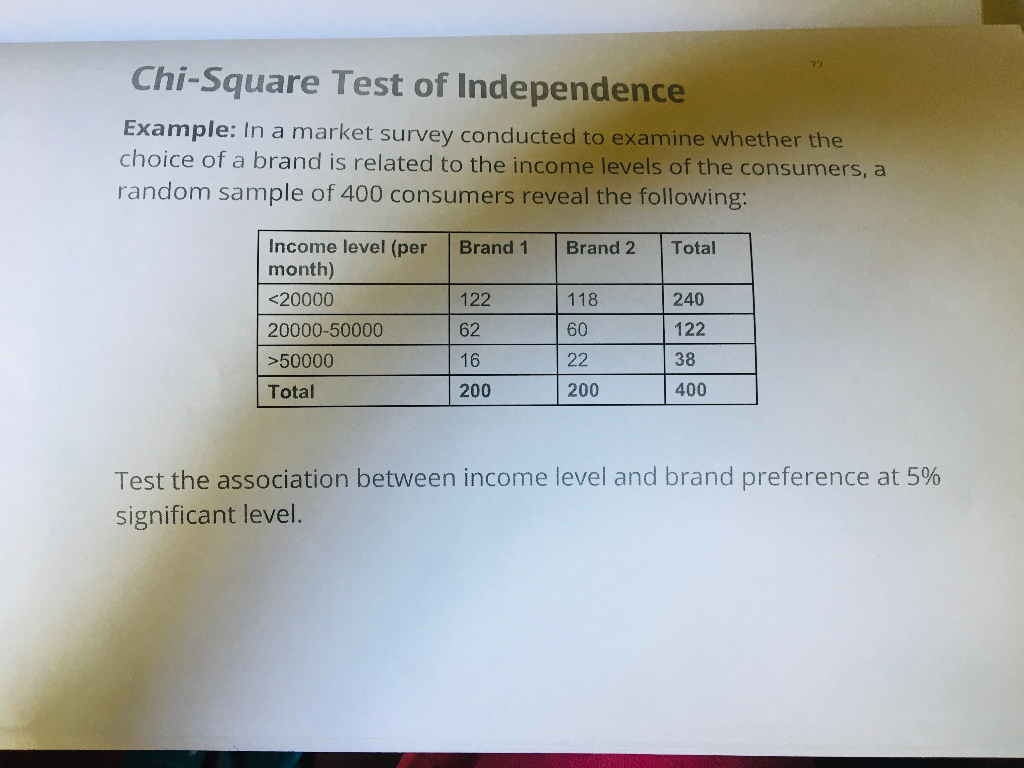
- Chi Square Test of Independence: Assesses whether two categorical variables are independent. It compares the observed frequencies in a contingency table to the frequencies expected if the variables were independent.
Key advantages of the Chi Square Test include its simplicity and flexibility in handling categorical data. It is particularly useful when dealing with large datasets and multiple categories.
Fisher's Exact Test
Fisher's Exact Test is used in place of the Chi Square Test for small sample sizes. Unlike the Chi Square Test, which approximates the distribution of the test statistic, Fisher's Exact Test calculates exact probabilities. This makes it more accurate when sample sizes are small or when the expected frequencies in any cell of a contingency table are less than 5.
Binomial Test
The Binomial Test is another alternative to the Chi Square Test, particularly for testing hypotheses about the distribution of binary data. It compares the observed number of successes in a fixed number of trials to the expected number under a specified probability of success. This test is exact and is preferred when dealing with dichotomous outcomes.
G-Test
The G-Test, or likelihood ratio test, is similar to the Chi Square Test but uses the likelihood ratio as the test statistic. It is often used for larger sample sizes and can provide more accurate results in some cases. The G-Test is particularly useful when the data violates some of the assumptions of the Chi Square Test, such as when dealing with small expected frequencies.
McNemar's Test
McNemar's Test is specifically designed for paired nominal data. It is used to test for changes in proportions on a dichotomous trait at two different times in the same group. This test is particularly useful in before-and-after studies or in matched pair studies.
Summary of Comparative Analysis
The choice between the Chi Square Test and other statistical tests depends on several factors:
- Sample Size: Fisher's Exact Test is preferred for small samples, while the Chi Square Test is suitable for larger samples.
- Type of Data: The Binomial Test is used for binary data, while the Chi Square Test is used for categorical data with more than two categories.
- Assumptions: The G-Test can be used when the assumptions of the Chi Square Test are violated.
- Study Design: McNemar's Test is specifically for paired data, unlike the Chi Square Test which is for unpaired data.
Each test has its strengths and is best suited for different scenarios. Understanding these differences allows researchers to choose the most appropriate test for their data and research questions.
Real-World Examples of Chi Square Test in One Sample Scenarios
The Chi-Square test is a versatile tool used in various real-world scenarios to test hypotheses about categorical data. Below are detailed examples illustrating how the Chi-Square test is applied in different contexts:
Example 1: Customer Distribution in a Store
Suppose a store owner claims that an equal number of customers visit his store each weekday. To test this claim, the number of customers visiting the store over a week is recorded:
- Monday: 50 customers
- Tuesday: 60 customers
- Wednesday: 40 customers
- Thursday: 47 customers
- Friday: 53 customers
The Chi-Square Goodness of Fit test can be used to determine if these observed frequencies differ significantly from the expected equal distribution.
We calculate the expected frequency for each day:
Using the formula for Chi-Square:
where \( O_i \) are the observed frequencies and \( E_i \) are the expected frequencies.
Calculating for each day:
With 4 degrees of freedom (df = 5 - 1), the critical value at α = 0.05 is 9.488. Since 4.36 < 9.488, we fail to reject the null hypothesis, indicating the distribution does not significantly differ from the expected equal distribution.
Example 2: Species Distribution in a Forest
A biologist hypothesizes that an equal number of four different species of deer enter a forest area each week. The observed counts for a week are:
- Species 1: 22
- Species 2: 20
- Species 3: 23
- Species 4: 35
The expected count for each species is:
Using the Chi-Square formula:
Calculating for each species:
With 3 degrees of freedom (df = 4 - 1), the critical value at α = 0.05 is 7.815. Since 5.52 < 7.815, we fail to reject the null hypothesis, indicating the observed distribution does not significantly differ from the expected equal distribution.
Example 3: Coin Toss Experiment
Consider an experiment where a coin is tossed 100 times resulting in 70 heads and 30 tails. We want to test if the coin is fair, expecting a 50-50 distribution:
The expected frequency for heads and tails is 50 each:
Using the Chi-Square formula:
With 1 degree of freedom (df = 2 - 1), the critical value at α = 0.05 is 3.841. Since 16 > 3.841, we reject the null hypothesis, indicating the coin is not fair.
Common Mistakes and How to Avoid Them in Chi Square Test
The Chi Square Test is a robust statistical tool used to assess the association between categorical variables. However, there are common mistakes that can undermine the validity of the test results. Here, we outline these mistakes and provide guidance on how to avoid them.
-
Misunderstanding the Assumptions:
One of the most critical aspects of conducting a Chi Square Test is understanding its assumptions. The data must be in a frequency format, and the categories must be mutually exclusive. Also, the expected frequency in each category should be at least 5 to ensure the validity of the test.
How to Avoid: Always check your data format and ensure it meets these assumptions. If the expected frequencies are too low, consider combining categories or using a different statistical test better suited for small sample sizes.
-
Inappropriate Use of Chi Square Test:
Another common mistake is using the Chi Square Test with continuous data or with a sample size that is too small. The test is designed for categorical data and large sample sizes.
How to Avoid: Verify that your data is categorical. If you have continuous data, consider using a different statistical test, such as a t-test or ANOVA. For small sample sizes, Fisher's Exact Test may be more appropriate.
-
Misinterpreting the P-Value:
The p-value in the Chi Square Test indicates whether the observed differences are statistically significant. A common error is to interpret a non-significant p-value as evidence that the variables are independent, without considering the context and sample size.
How to Avoid: Understand that a non-significant result does not confirm independence. It may indicate insufficient evidence to reject the null hypothesis. Consider the effect size and confidence intervals for a more comprehensive interpretation.
-
Incorrect Calculation of Expected Frequencies:
The Chi Square Test compares observed frequencies to expected frequencies, which must be calculated correctly based on the marginal totals of the contingency table.
How to Avoid: Ensure that you accurately calculate the expected frequencies using the formula \(E = \frac{(row \, total \times column \, total)}{grand \, total}\). Double-check your calculations to prevent errors.
-
Ignoring the Degrees of Freedom:
The degrees of freedom (df) are crucial in determining the critical value from the Chi Square distribution table. Miscalculating df can lead to incorrect conclusions.
How to Avoid: For a goodness-of-fit test, df is calculated as the number of categories minus one (\(df = k - 1\)). For a test of independence, it is calculated as \((r - 1) \times (c - 1)\), where r and c are the number of rows and columns, respectively.
By being aware of these common mistakes and taking steps to avoid them, researchers can ensure the validity and reliability of their Chi Square Test results.
Conclusion: Summary of Key Points on Chi Square Test One Sample
The Chi Square Test for one sample, also known as the Chi Square Goodness-of-Fit Test, is a powerful statistical tool used to determine if observed data matches expected data based on a specific hypothesis. Here are the key points summarizing this test:
-
Purpose:
The test is used to compare the observed frequencies of events with the expected frequencies to see if there is a significant difference. It is particularly useful for categorical data.
-
Hypotheses:
- Null Hypothesis (\(H_0\)): The observed frequencies match the expected frequencies.
- Alternative Hypothesis (\(H_a\)): The observed frequencies do not match the expected frequencies.
-
Calculation:
The test statistic is calculated using the formula:
\[
\chi^2 = \sum \frac{(O_i - E_i)^2}{E_i}
\]where \(O_i\) is the observed frequency and \(E_i\) is the expected frequency.
-
Degrees of Freedom:
The degrees of freedom for the test are calculated as the number of categories minus one (\(df = k - 1\)).
-
Assumptions:
- Data should be a random sample from the population.
- Each observation should fall into one category (mutually exclusive).
- Expected frequency in each category should be at least 5 to ensure the validity of the test.
-
Interpretation:
A significant Chi Square value indicates that the observed data does not fit the expected distribution, leading to the rejection of the null hypothesis. However, the test does not indicate the direction or magnitude of the difference.
-
Limitations:
The Chi Square Test is sensitive to sample size and may not be reliable with small sample sizes or when the expected frequency in any category is less than 5.
-
Applications:
This test is widely used in various fields such as genetics, marketing, and social sciences to test hypotheses about categorical data.
In summary, the Chi Square Test for one sample is an essential tool for testing the goodness-of-fit for categorical data. It helps determine whether the observed data conforms to a specified distribution, provided the assumptions are met and the sample size is adequate.
Kiểm tra chi bình phương một mẫu


:max_bytes(150000):strip_icc()/Chi-SquareStatistic_Final_4199464-7eebcd71a4bf4d9ca1a88d278845e674.jpg)