Topic two sample chi square test: The two-sample chi-square test is a powerful statistical tool used to examine the relationship between two categorical variables. This article provides a comprehensive overview of the test, its applications, and the steps involved in performing it, making it an essential read for researchers and students alike.
Table of Content
- Two Sample Chi-Square Test
- Introduction to Two Sample Chi-Square Test
- Types of Chi-Square Tests
- Purpose and Applications
- Steps to Perform a Two Sample Chi-Square Test
- Calculations and Formulas
- Examples of Two Sample Chi-Square Tests
- Assumptions and Limitations
- Advanced Topics
- Common Misconceptions
- Further Reading and Resources
- YOUTUBE: Khám phá video về Phân Tích Chi-Square để hiểu về phương pháp thống kê này và cách áp dụng nó trong nghiên cứu và phân tích dữ liệu.
Two Sample Chi-Square Test
The two-sample chi-square test is used to determine whether two categorical variables are independent of each other. This statistical test is commonly applied in various fields, including social sciences, biology, and marketing research.
Understanding the Test
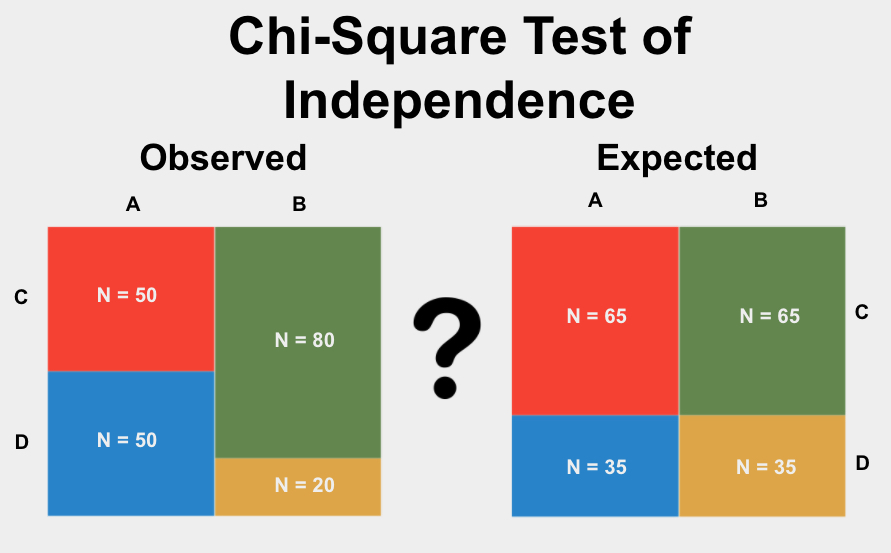
The test compares the observed frequencies in each category of a contingency table to the expected frequencies, which are calculated under the assumption that the two variables are independent.
Formula
The test statistic for the chi-square test is calculated using the formula:
\[
X^2 = \sum \frac{(O_i - E_i)^2}{E_i}
\]
where:
- \(O_i\) = Observed frequency in category \(i\)
- \(E_i\) = Expected frequency in category \(i\)
Steps to Perform the Test
- Calculate Expected Frequencies: Use the formula: \[ E_i = \frac{(\text{Row total}) \times (\text{Column total})}{\text{Grand total}} \]
- Compute the Test Statistic: Apply the chi-square formula to compute the test statistic \(X^2\).
- Determine the Degrees of Freedom: Calculate the degrees of freedom using: \[ df = (r - 1) \times (c - 1) \] where \(r\) is the number of rows and \(c\) is the number of columns.
- Find the Critical Value: Use a chi-square distribution table to find the critical value for the given significance level \(\alpha\) and degrees of freedom.
- Compare and Conclude: Compare the test statistic to the critical value. If \(X^2\) is greater than the critical value, reject the null hypothesis of independence.
Example
Consider a study testing the effectiveness of different interventions on recycling behavior. The observed and expected frequencies are tabulated, and the test statistic is calculated as follows:
| Intervention | Outcome | Observed (O) | Expected (E) | \(O - E\) | \((O - E)^2\) | \(\frac{(O - E)^2}{E}\) |
| Flyer | Recycle | 89 | 84.61 | 4.39 | 19.27 | 0.23 |
| Flyer | Not Recycle | 9 | 13.39 | -4.39 | 19.27 | 1.44 |
| Phone Call | Recycle | 84 | 79.43 | 4.57 | 20.88 | 0.26 |
| Phone Call | Not Recycle | 8 | 12.57 | -4.57 | 20.88 | 1.66 |
| Control | Recycle | 86 | 94.97 | -8.97 | 80.46 | 0.85 |
| Control | Not Recycle | 24 | 15.03 | 8.97 | 80.46 | 5.35 |
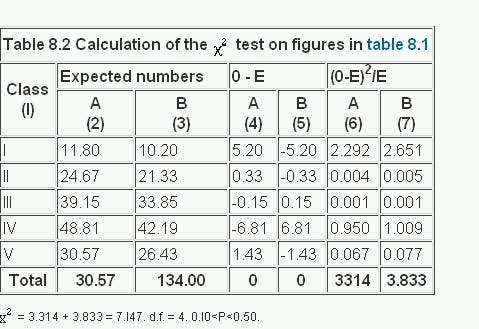
The chi-square test statistic is calculated by summing the last column:
\[
X^2 = 0.23 + 1.44 + 0.26 + 1.66 + 0.85 + 5.35 = 9.79
\]
If the critical value at \(df = 2\) and \(\alpha = 0.05\) is 5.99, we compare 9.79 with 5.99 and conclude that the observed frequencies are significantly different from the expected frequencies, indicating that the intervention methods impact recycling behavior.
In conclusion, the two-sample chi-square test is a versatile tool for testing the independence of categorical variables. It provides valuable insights into the relationships between different categorical data sets.

READ MORE:
Introduction to Two Sample Chi-Square Test
The two sample chi-square test is a statistical method used to determine if there is a significant association between two categorical variables across two different samples. This test compares the observed frequencies in each category with the frequencies expected if the variables were independent.
Here are the steps to perform a two sample chi-square test:
- Formulate the hypotheses:
- Null Hypothesis (H0): There is no association between the two categorical variables.
- Alternative Hypothesis (H1): There is an association between the two categorical variables.
- Create a contingency table to summarize the observed frequencies of the variables.
- Calculate the expected frequencies for each cell in the table using the formula:
\[ \text{Expected Frequency} = \frac{\text{(Row Total) * (Column Total)}}{\text{Grand Total}} \]
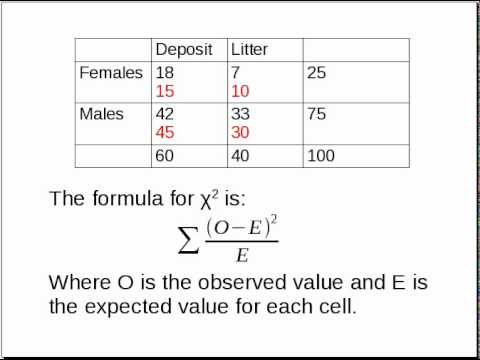
- Compute the chi-square statistic using the formula:
\[ \chi^2 = \sum \frac{(O_i - E_i)^2}{E_i} \]
where \( O_i \) is the observed frequency and \( E_i \) is the expected frequency.
- Determine the degrees of freedom for the test using the formula:
\[ \text{Degrees of Freedom} = (r - 1) \times (c - 1) \]
where \( r \) is the number of rows and \( c \) is the number of columns.
- Compare the chi-square statistic to the critical value from the chi-square distribution table with the appropriate degrees of freedom to determine the p-value.
- Draw a conclusion:
- If the p-value is less than the significance level (e.g., 0.05), reject the null hypothesis.
- If the p-value is greater than the significance level, fail to reject the null hypothesis.
The two sample chi-square test is a powerful tool for analyzing categorical data, but it's important to remember that it only indicates association, not causation.
Types of Chi-Square Tests
The chi-square test is a statistical method used to determine if there is a significant association between categorical variables. There are two main types of chi-square tests:
- Chi-Square Goodness of Fit Test
- Example: Checking if the distribution of colors in a bag of M&Ms matches the expected distribution.
- Calculation: The test statistic is calculated as:
- Chi-Square Test of Independence
- Example: Determining if there is an association between gender and voting preference.
- Calculation: The test statistic is calculated similarly:
This test is used to determine if a sample data matches an expected distribution. It is applied when there is a single categorical variable from a single population. The observed frequencies of events are compared to the expected frequencies derived from a specific hypothesis.
\[ \chi^2 = \sum \frac{(O_i - E_i)^2}{E_i} \]
where \( O_i \) is the observed frequency and \( E_i \) is the expected frequency.
This test is used to determine if there is a significant association between two categorical variables. It is applied to a contingency table where data is classified according to two categorical variables.
\[ \chi^2 = \sum \frac{(O_i - E_i)^2}{E_i} \]
where the expected frequency \( E_i \) is calculated based on the assumption of independence.
Both tests rely on comparing the test statistic to a chi-square distribution with appropriate degrees of freedom to determine if the observed data significantly deviates from the expected data.
Purpose and Applications
The two sample chi-square test is a statistical method used to determine whether there is a significant association between two categorical variables. This test is widely used in various fields to analyze data and make informed decisions. Below are some common purposes and applications of the two sample chi-square test:
- Hypothesis Testing: The primary purpose of the two sample chi-square test is to test the null hypothesis, which states that there is no association between the two variables. By comparing observed frequencies with expected frequencies, researchers can determine if there is a significant relationship between the variables.
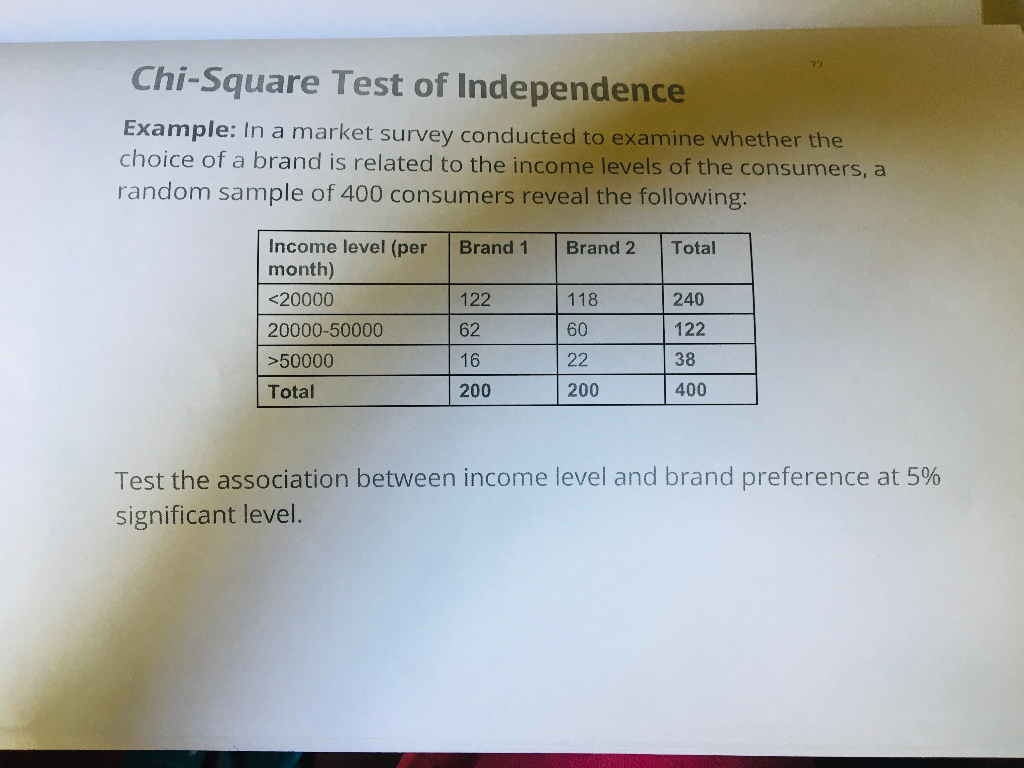
- Market Research: Businesses use this test to understand consumer behavior. For example, a company may want to know if there is a relationship between age groups and product preferences.
- Healthcare: In medical research, the chi-square test can help identify associations between different treatment methods and patient outcomes. It can also be used to examine the relationship between demographic factors and health conditions.
- Social Sciences: Sociologists and psychologists use this test to explore the relationship between social factors and human behavior. For instance, it can be used to study the association between education level and voting patterns.
- Quality Control: In manufacturing, the chi-square test helps in quality control by determining if the distribution of defective products is independent of the production method used.
Conducting a two sample chi-square test involves the following steps:
- Define the Hypotheses: Establish the null hypothesis (no association) and the alternative hypothesis (association exists).
- Construct a Contingency Table: Organize the data into a contingency table showing the frequency distribution of the variables.
- Calculate the Expected Frequencies: For each cell in the table, calculate the expected frequency assuming the null hypothesis is true.
- Compute the Chi-Square Statistic: Use the formula \(\chi^2 = \sum \frac{(O_i - E_i)^2}{E_i}\) where \(O_i\) is the observed frequency and \(E_i\) is the expected frequency.
- Determine the p-Value: Compare the chi-square statistic to the critical value from the chi-square distribution table to find the p-value.
- Draw Conclusions: If the p-value is less than the chosen significance level (e.g., 0.05), reject the null hypothesis, indicating a significant association between the variables.
In summary, the two sample chi-square test is a versatile tool used across various disciplines to analyze categorical data and draw meaningful conclusions about the relationships between variables.
Steps to Perform a Two Sample Chi-Square Test
The Two Sample Chi-Square Test is used to determine if there is a significant association between two categorical variables. Here is a detailed, step-by-step guide to performing this test:
- Define the Null and Alternative Hypotheses:
State your hypotheses clearly. The null hypothesis (H0) assumes there is no association between the variables, while the alternative hypothesis (H1) assumes there is an association.
- Create a Contingency Table:
Organize the observed data into a contingency table, which shows the frequency distribution of the variables.
Category 1 Category 2 Total Group 1 Observed Frequency (O11) Observed Frequency (O12) Row Total (R1) Group 2 Observed Frequency (O21) Observed Frequency (O22) Row Total (R2) Total Column Total (C1) Column Total (C2) Grand Total (N) - Calculate Expected Frequencies:
Use the formula for expected frequencies:
\[
E_{ij} = \frac{R_i \times C_j}{N}
\]
where \( E_{ij} \) is the expected frequency for the cell in the i-th row and j-th column, \( R_i \) is the total for row i, \( C_j \) is the total for column j, and \( N \) is the grand total. - Compute the Chi-Square Statistic:
Calculate the Chi-Square statistic using the formula:
\[
\chi^2 = \sum \frac{(O_{ij} - E_{ij})^2}{E_{ij}}
\]
where \( O_{ij} \) is the observed frequency and \( E_{ij} \) is the expected frequency. - Determine Degrees of Freedom:
The degrees of freedom for the test is given by:
\[
df = (r - 1) \times (c - 1)
\]
where \( r \) is the number of rows and \( c \) is the number of columns in the contingency table. - Find the Critical Value and Compare:
Using a Chi-Square distribution table, find the critical value corresponding to your degrees of freedom and significance level (commonly α = 0.05). Compare the calculated Chi-Square statistic to the critical value.
- Make a Decision:
If the Chi-Square statistic is greater than the critical value, reject the null hypothesis. Otherwise, fail to reject the null hypothesis. This decision indicates whether there is a significant association between the variables.
Following these steps will help you accurately perform a Two Sample Chi-Square Test and interpret the results effectively.
Calculations and Formulas
The calculations for a two-sample chi-square test involve several key steps to compare the observed frequencies to the expected frequencies under the null hypothesis. Below is a detailed breakdown of the calculations and formulas used in this test.
Steps to Calculate the Chi-Square Statistic
- Collect the observed frequencies (O) from your data for each category.
- Calculate the expected frequencies (E) for each category using the formula:
Expected frequency \(E = \frac{(\text{Row total}) \times (\text{Column total})}{\text{Grand total}}\)
- Compute the chi-square statistic using the formula:
\[
\chi^2 = \sum \frac{(O - E)^2}{E}
\]
Example Calculation
| Category | Observed (O) | Expected (E) | \((O - E)^2 / E\) |
|---|---|---|---|
| Category 1 | 20 | 15 | 1.67 |
| Category 2 | 30 | 35 | 0.71 |
| Category 3 | 50 | 50 | 0 |
| Category 4 | 40 | 40 | 0 |
Summing the last column gives the chi-square statistic:
\[
\chi^2 = 1.67 + 0.71 + 0 + 0 = 2.38
\]
Degrees of Freedom and P-Value
The degrees of freedom (df) for the chi-square test are calculated as:
\[
\text{df} = (\text{Number of rows} - 1) \times (\text{Number of columns} - 1)
\]
In this example, if we have 2 rows and 2 columns:
\[
\text{df} = (2 - 1) \times (2 - 1) = 1
\]
Using the chi-square distribution table, we can find the p-value corresponding to the calculated chi-square statistic and the degrees of freedom. If the p-value is less than the significance level (usually 0.05), we reject the null hypothesis.
Conclusion
By following these steps and using the provided formulas, one can effectively conduct a two-sample chi-square test to determine if there are significant differences between the observed and expected frequencies in categorical data.
Examples of Two Sample Chi-Square Tests
The two sample chi-square test is commonly used to determine if there is a significant association between two categorical variables. Below are detailed examples illustrating the application of this test.
- Example 1: Gender and Political Party Preference
- Hypothesis Definition:
- \( H_0 \): There is no association between gender and political party preference.
- \( H_1 \): There is an association between gender and political party preference.
- Data Collection: A survey of 440 voters is conducted to determine their gender and political party preference.
- Observed Values: The data collected is tabulated as follows:
Republican Democrat Independent Total Male 120 90 40 250 Female 110 95 45 250 Total 230 185 85 500 - Expected Values Calculation: The expected frequencies are calculated using the formula:
\[
\text{Expected Value} = \frac{(\text{Row Total}) \times (\text{Column Total})}{\text{Grand Total}}
\]Republican Democrat Independent Male 115 92.5 42.5 Female 115 92.5 42.5 - Chi-Square Calculation: The chi-square statistic is calculated using the formula:
\[
\chi^2 = \sum \frac{(O_i - E_i)^2}{E_i}
\]For each cell, the chi-square value is calculated and summed up to obtain the test statistic.
- Degrees of Freedom: Calculated as:
\[
(r-1) \times (c-1) = (2-1) \times (3-1) = 2
\] - Conclusion: Compare the test statistic to the critical value from the chi-square distribution table at a chosen significance level (e.g., 0.05). If the test statistic exceeds the critical value, reject the null hypothesis, indicating a significant association between gender and political party preference.
- Hypothesis Definition:
- Example 2: Medication Effectiveness
- Hypothesis Definition:
- \( H_0 \): There is no association between medication type and recovery rate.
- \( H_1 \): There is an association between medication type and recovery rate.
- Data Collection: A clinical trial with two medications and patient recovery rates.
- Observed Values: Tabulated data showing recovery status for each medication type.
- Expected Values Calculation: Expected frequencies based on overall recovery rates and medication distribution.
- Chi-Square Calculation: Use the chi-square formula to calculate the test statistic.
- Degrees of Freedom: Calculated based on the number of categories for each variable.
- Conclusion: Determine if there is a significant association based on the chi-square statistic and critical value comparison.
- Hypothesis Definition:
Assumptions and Limitations
- Data Requirements: The validity of the two sample chi-square test assumes that the data used are categorical and represent independent samples from the population.
- Sample Size Considerations: Larger sample sizes generally provide more reliable results. Smaller samples can lead to unreliable chi-square statistics, especially if any expected frequency is less than 5.
- Interpreting Results: Caution is needed when interpreting chi-square results, as statistical significance does not imply practical significance. Significant results only indicate a relationship between variables, not the nature or strength of that relationship.
Advanced Topics
- Cramer's V and Effect Size: Cramer's V is a measure of association for nominal variables, extending the interpretation of chi-square results beyond statistical significance to assess the strength of the relationship. Effect size metrics help quantify the practical importance of the observed associations.
- Yates's Correction for Continuity: This correction adjusts the chi-square statistic in 2x2 contingency tables to better approximate the exact distribution of the test statistic, especially when sample sizes are small.
- Chi-Square Test Variations: Various modifications exist to accommodate different research scenarios, such as Fisher's Exact Test for small sample sizes or Monte Carlo simulations for complex data structures.
Common Misconceptions
- Association vs. Causation: Finding a significant association between variables using the two sample chi-square test does not imply causation. It only indicates that there is a relationship or dependency between the variables.
- Misuse with Continuous Data: The two sample chi-square test is designed for categorical data analysis. Using it with continuous or ordinal data can lead to inaccurate results and misinterpretations.
Further Reading and Resources
- Statistical Textbooks: Explore textbooks on statistical methods and analysis, which often include detailed sections on the two sample chi-square test and its applications.
- Online Courses: Enroll in online courses offered by universities or platforms specializing in statistics and data analysis to deepen your understanding of the two sample chi-square test.
- Software Tutorials: Utilize tutorials provided by statistical software packages like SPSS, R, or Python to learn how to conduct and interpret two sample chi-square tests using computational tools.
Khám phá video về Phân Tích Chi-Square để hiểu về phương pháp thống kê này và cách áp dụng nó trong nghiên cứu và phân tích dữ liệu.
Phân Tích Chi-Square: Khóa Học Ngắn Về Thống Kê #29
READ MORE:
Phân tích Xích ma vuông trong SPSS và cách giải thích kết quả
Phân tích Xích ma vuông trong SPSS + giải thích


:max_bytes(150000):strip_icc()/Chi-SquareStatistic_Final_4199464-7eebcd71a4bf4d9ca1a88d278845e674.jpg)