Topic sample size chi square test: Understanding the correct sample size for a chi-square test is crucial for accurate statistical analysis. This article explores the methods and considerations involved in determining the optimal sample size for your chi-square test, ensuring reliable and valid results in your research or data analysis projects. Read on to discover best practices and essential tips for conducting chi-square tests effectively.
Table of Content
- Sample Size and Chi-Square Test
- Introduction
- Understanding the Chi-Square Test
- Types of Chi-Square Tests
- Assumptions and Requirements
- Steps to Perform a Chi-Square Test
- Calculating Sample Size for Chi-Square Tests
- Interpreting Results
- Applications of Chi-Square Test
- Limitations and Considerations
- Practical Examples
- Further Reading and Resources
- YOUTUBE: Video về kiểm tra Chi-Square và cách xác định kích thước mẫu phù hợp, giúp thu hút người xem và cải thiện hiểu biết của họ về các phương pháp thống kê.
Sample Size and Chi-Square Test
The chi-square test is a statistical method commonly used to determine if there is a significant association between categorical variables. The sample size plays a crucial role in the accuracy and validity of this test. Below is a comprehensive guide on understanding the relationship between sample size and chi-square tests, including calculations, expected frequencies, and common applications.
Key Concepts
- Chi-Square Test of Independence
- Goodness of Fit
- Expected Frequencies
Calculating Chi-Square
To perform a chi-square test, follow these steps:
- Calculate the expected frequencies using the formula: \[ E = \frac{(\text{Row Total} \times \text{Column Total})}{\text{Grand Total}} \]
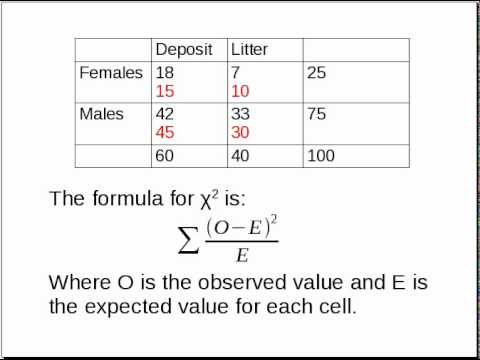
- Compute the chi-square statistic: \[ \chi^2 = \sum \frac{(O - E)^2}{E} \]
- Determine the degrees of freedom: \[ \text{df} = (r - 1) \times (c - 1) \]
- Compare the calculated chi-square value to the critical value from the chi-square distribution table.
Example Calculation
Consider a survey to determine if gender influences political party preference. The observed frequencies and expected frequencies are calculated as follows:
| Gender | Republican | Democrat | Independent |
|---|---|---|---|
| Male | 30 | 50 | 20 |
| Female | 20 | 60 | 20 |
Calculate the expected frequencies and use the chi-square formula to find the test statistic.
Effect of Sample Size
Larger sample sizes tend to produce more reliable results in chi-square tests. However, with very large samples, even small differences can appear statistically significant. Conversely, small sample sizes may not provide sufficient power to detect a true effect.
Minimum Expected Cell Count
To ensure the validity of the chi-square test, each cell in the contingency table should have an expected frequency of at least 5. If this condition is not met, consider combining categories or using an alternative test like Fisher's exact test.
Applications
- Survey analysis in social sciences
- Market research
- Public health studies
Conclusion
The chi-square test is a versatile tool for analyzing categorical data. Understanding the impact of sample size and ensuring adequate expected frequencies are crucial for accurate results.

READ MORE:
Introduction
The chi-square test is a statistical method used to determine if there is a significant association between two categorical variables. This test is widely applicable in various fields such as social sciences, biology, and marketing research, where it helps to understand relationships within categorical data. The accuracy and validity of the chi-square test are highly dependent on the sample size. In this section, we will explore the importance of sample size in conducting a chi-square test, how to calculate the required sample size, and the implications of using an insufficient sample size.
When conducting a chi-square test, the sample size should be large enough to ensure that the expected frequency in each category is adequate, typically at least 5. If the sample size is too small, the chi-square test may not provide reliable results, and alternative tests like Fisher's Exact Test might be recommended. Various software tools and statistical methods can assist in determining the appropriate sample size for a chi-square test, taking into account the desired power of the test and the effect size.
The following steps outline the general procedure for performing a chi-square test:
- Define the null and alternative hypotheses.
- Calculate the expected frequencies based on the sample data.
- Compute the chi-square statistic using the formula:
\(\chi^2 = \sum \frac{(O - E)^2}{E}\)
where \(O\) is the observed frequency and \(E\) is the expected frequency. - Determine the degrees of freedom, which is typically the number of categories minus one.
- Compare the calculated chi-square statistic to the critical value from the chi-square distribution table to decide whether to reject the null hypothesis.
In summary, the sample size plays a crucial role in the reliability of the chi-square test results. Adequate sample size ensures that the test has enough power to detect a significant effect, if one exists, and reduces the likelihood of Type II errors. Researchers must carefully consider the sample size when planning their studies to make valid and accurate inferences from their data.
Understanding the Chi-Square Test
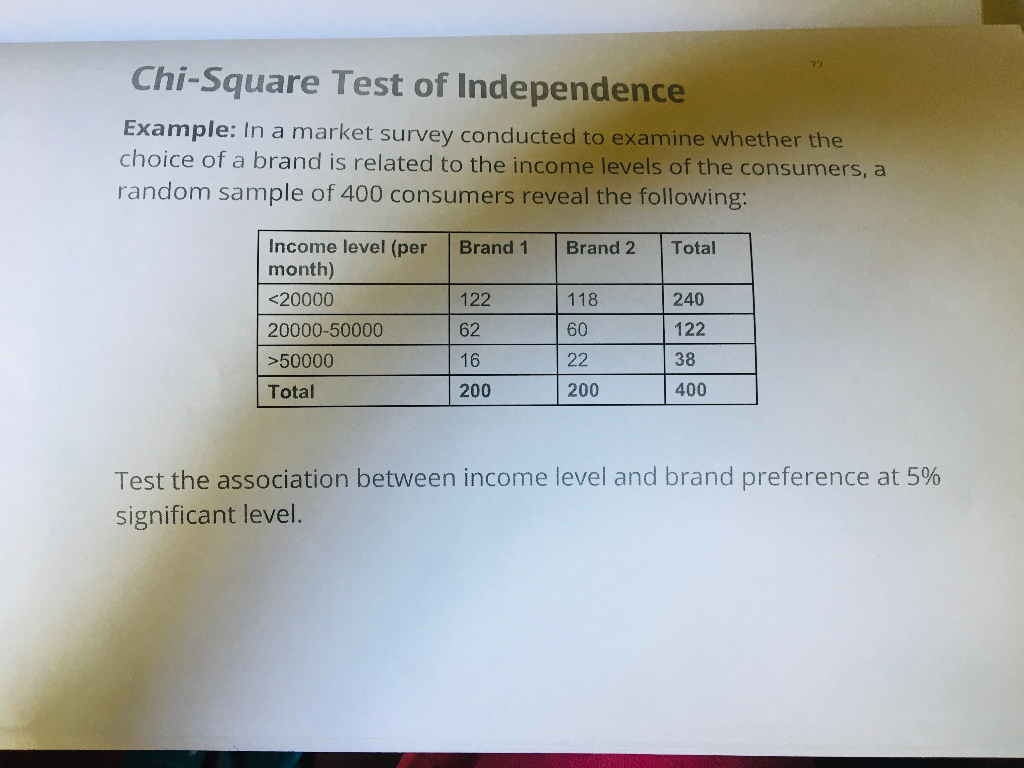
The Chi-Square test is a statistical method used to determine if there is a significant association between categorical variables. It is widely used in research areas such as marketing, political science, and healthcare to analyze survey data and other categorical data.
The Chi-Square test compares the observed frequencies of events with the expected frequencies under the assumption that the null hypothesis is true. There are two main types of Chi-Square tests: the Chi-Square test of independence and the Chi-Square goodness-of-fit test.
Here is a step-by-step process to perform a Chi-Square test:
- Define the Hypotheses:
- Null Hypothesis (H0): Assumes no association between the variables.
- Alternative Hypothesis (H1): Assumes an association between the variables.
- Calculate the Expected Frequencies:
The expected frequency for each cell in a contingency table is calculated using the formula:
\[
E = \frac{(\text{Row Total} \times \text{Column Total})}{\text{Grand Total}}
\] - Compute the Chi-Square Statistic:
The Chi-Square statistic is calculated using the formula:
\[
\chi^2 = \sum \frac{(O - E)^2}{E}
\]
Where \(O\) represents the observed frequency and \(E\) represents the expected frequency. - Determine the Degrees of Freedom:
The degrees of freedom (df) for a Chi-Square test of independence is calculated as:
\[
\text{df} = (r - 1) \times (c - 1)
\]
Where \(r\) is the number of rows and \(c\) is the number of columns. - Compare the Chi-Square Statistic to the Critical Value:
Find the critical value from the Chi-Square distribution table using the calculated degrees of freedom and the desired significance level (typically 0.05). Compare the calculated Chi-Square statistic to this critical value to determine whether to reject the null hypothesis.
If the calculated Chi-Square statistic is greater than the critical value, the null hypothesis is rejected, indicating a significant association between the variables.
Types of Chi-Square Tests
The Chi-Square test is a non-parametric statistical method used to determine if there is a significant association between categorical variables. There are several types of Chi-Square tests, each serving different purposes and used under specific conditions. Here are the main types:
- Chi-Square Test of Independence: This test is used to determine if there is a significant relationship between two categorical variables. It compares the observed frequencies in a contingency table to the frequencies expected if the variables were independent.
- Chi-Square Goodness of Fit Test: This test determines how well the observed sample distribution fits an expected distribution. It is commonly used to test hypotheses about the distribution of categorical variables.
- Chi-Square Test for Homogeneity: This test is used to determine if different samples come from populations with the same distribution. It is similar to the test of independence but is used when comparing two or more populations.
- Yates's Correction for Continuity: This correction is applied to the Chi-Square test in 2x2 tables to reduce the approximation error, especially useful for small sample sizes.
- McNemar's Test: This is a specific type of Chi-Square test used for matched pair data to determine if there are differences in the distributions of two related samples.
- Cochran-Mantel-Haenszel Chi-Square Test: This test assesses the association between two categorical variables while controlling for a third variable.
- Chi-Square Test for Variance: This test checks if the variance of a normally distributed population is equal to a specified value, useful in quality control processes.
Each of these tests plays a crucial role in statistical analysis, providing researchers with the tools to make informed decisions based on categorical data.
Assumptions and Requirements
The Chi-Square Test is a widely used statistical tool for determining the association between categorical variables. However, for its results to be valid, certain assumptions and requirements must be met. These include:
- Random Sampling: The data should be collected through a process of random sampling to ensure that each observation is independent and representative of the population.
- Independence of Observations: Each observation should be independent of others, meaning the outcome of one observation does not influence another.
- Expected Frequency: In each cell of the contingency table, the expected frequency should be at least 5. If expected frequencies are lower, the Chi-Square Test may not be reliable, and alternative methods like Fisher's Exact Test should be considered.
- Sufficient Sample Size: The test is more accurate with larger sample sizes. Small sample sizes can lead to inaccurate results and increase the likelihood of Type II errors (failing to detect an actual association).
- Data Type: The data should be categorical, either nominal or ordinal. Continuous data must be categorized appropriately before applying the test.
- No Missing Data: The test does not handle missing data well. Any missing values should be addressed through appropriate imputation methods before analysis.
By adhering to these assumptions and requirements, researchers can ensure the validity and reliability of the Chi-Square Test results, leading to more accurate conclusions in their studies.

Steps to Perform a Chi-Square Test
The Chi-Square Test is a statistical method used to determine if there is a significant association between categorical variables. Follow these detailed steps to perform a Chi-Square Test:
-
Define the Hypothesis
- Null Hypothesis (H0): Assumes no association between the variables.
- Alternative Hypothesis (H1): Assumes an association between the variables.
-
Construct a Contingency Table
Tabulate the observed frequencies of the variables in a matrix format, where rows represent categories of one variable and columns represent categories of another variable.
-
Calculate the Expected Frequencies
Use the formula to calculate the expected frequencies for each cell in the contingency table:
\[
E_{ij} = \frac{(\text{Row Total}_i \times \text{Column Total}_j)}{\text{Grand Total}}
\] -
Compute the Chi-Square Statistic
Apply the Chi-Square formula to compute the test statistic:
\[
\chi^2 = \sum \frac{(O_{ij} - E_{ij})^2}{E_{ij}}
\]Where \( O_{ij} \) is the observed frequency and \( E_{ij} \) is the expected frequency for each cell.
-
Determine the Degrees of Freedom
The degrees of freedom for the test are calculated as:
\[
\text{df} = (r - 1) \times (c - 1)
\]Where \( r \) is the number of rows and \( c \) is the number of columns.
-
Find the Critical Value
Refer to a Chi-Square distribution table to find the critical value based on the degrees of freedom and the chosen significance level (usually \( \alpha = 0.05 \)).
-
Compare the Test Statistic to the Critical Value
Compare the calculated Chi-Square statistic to the critical value:
- If \( \chi^2 \) is greater than the critical value, reject the null hypothesis.
- If \( \chi^2 \) is less than or equal to the critical value, do not reject the null hypothesis.
-
Interpret the Results
Based on the comparison, conclude whether there is a significant association between the variables.
Calculating Sample Size for Chi-Square Tests
Calculating the appropriate sample size for chi-square tests is crucial to ensure the validity and reliability of the test results. The sample size impacts the power of the test and the ability to detect significant differences or associations. Below are the steps to calculate the sample size for chi-square tests:
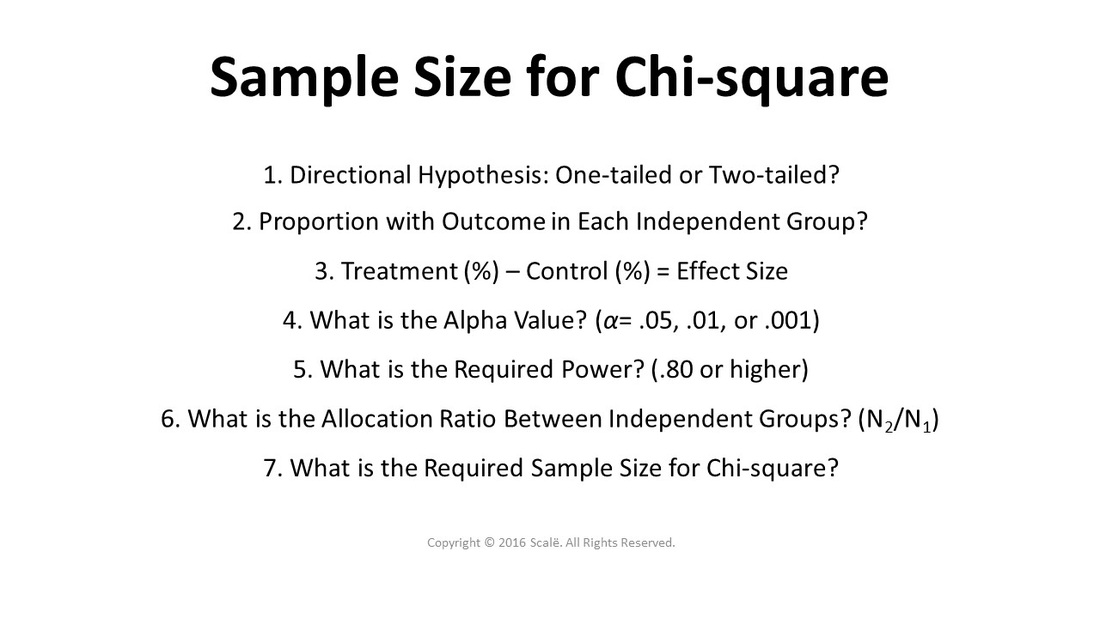
-
Define the Hypotheses:
- Null Hypothesis (\(H_0\)): Assumes no association between the variables.
- Alternative Hypothesis (\(H_1\)): Assumes there is an association between the variables.
Determine the Effect Size:
- The effect size quantifies the strength of the association between variables.
- Cohen's effect size for chi-square tests can be used, where small, medium, and large effect sizes are defined as 0.1, 0.3, and 0.5 respectively.
Set the Significance Level (\(\alpha\)):
- Commonly set at 0.05, representing a 5% risk of concluding that there is an effect when there is none.
Determine the Power (\(1-\beta\)):
- The power of the test is typically set at 0.80 or 80%, which is the probability of correctly rejecting the null hypothesis.
Calculate the Degrees of Freedom:
- Degrees of freedom for a chi-square test are calculated as \((r-1) \times (c-1)\), where \(r\) is the number of rows and \(c\) is the number of columns in the contingency table.
Use a Sample Size Formula or Software:
- Sample size formulas and software tools like G*Power can be used to calculate the required sample size.
- For a chi-square test, the sample size (\(N\)) can be calculated using the formula:
\[
N = \frac{\chi^2 (\alpha, df) \times (1 - \beta)}{(\text{Effect Size})^2}
\]
where \(\chi^2 (\alpha, df)\) is the critical value from the chi-square distribution.
Adjust for Practical Considerations:
- Consider factors such as population size, response rates, and potential dropouts.
By following these steps, researchers can ensure they have an adequate sample size for their chi-square test, leading to more accurate and reliable results.
Interpreting Results
Interpreting the results of a Chi-Square test involves several steps to ensure that the conclusions drawn are both statistically and practically significant.
1. Understanding P-Values
The p-value indicates the probability that the observed data would occur by chance under the null hypothesis. If the p-value is less than the chosen significance level (commonly 0.05), the null hypothesis can be rejected. This suggests that there is a statistically significant association between the variables.
For example, if the p-value is 0.03, and the significance level is 0.05, you reject the null hypothesis, concluding that there is a significant association between the variables.
2. Effect Sizes and Their Importance
While the p-value indicates whether an effect exists, the effect size measures the strength of the association between variables. For Chi-Square tests, common measures of effect size include:
- Cramer's V: Suitable for larger contingency tables, providing a value between 0 and 1, where higher values indicate a stronger association.
- Pearson's Phi: Used for 2x2 tables, providing a similar interpretation to Cramer's V.
Effect sizes are crucial because they offer context to the statistical significance, indicating whether the association is strong enough to be practically important.
3. Practical Significance
Statistical significance does not always imply practical significance. For instance, a large sample size might result in a statistically significant p-value even for a very weak association. It's important to consider the effect size and the practical implications of the findings in the context of the research question.
4. Contextual Interpretation
Always interpret the results in the context of your study. Consider the theoretical framework, the research hypothesis, and other relevant findings. For example, if studying the association between diet and health outcomes, a statistically significant result should be discussed in the context of dietary guidelines and health recommendations.
5. Reporting Results
When reporting Chi-Square test results, include the Chi-Square statistic (χ²), degrees of freedom (df), and the p-value. For example:
χ²(1, N = 100) = 10.36, p < 0.01
This format provides all the necessary information for others to understand the test outcome.
6. Limitations
Consider the limitations of the Chi-Square test, such as sensitivity to sample size and the requirement for expected frequencies to be sufficiently large (typically at least 5). Small sample sizes can lead to inaccurate results, and in such cases, alternative tests or exact tests might be more appropriate.
By carefully considering these aspects, you can ensure that your interpretation of Chi-Square test results is both accurate and meaningful.
Applications of Chi-Square Test
The Chi-Square test is a versatile statistical tool used in various fields to analyze categorical data and assess relationships between variables. Below are some of its key applications:
-
In Market Research
Market researchers use the Chi-Square test to understand consumer behavior and preferences. For example, they might analyze if there is a significant association between product preferences and different demographic groups such as age, gender, or income levels. This helps companies tailor their marketing strategies to target specific groups more effectively.
-
In Social Sciences
In social sciences, the Chi-Square test is commonly used to examine the relationships between categorical variables. For instance, researchers might investigate whether there is a significant relationship between educational level and voting behavior in an election. This can provide insights into how different social factors influence political decisions.
-
In Medical Studies
Medical researchers use the Chi-Square test to determine if there is an association between different treatment methods and health outcomes. For example, they might test whether a new drug is effective in reducing symptoms compared to a placebo. This helps in validating the efficacy of new treatments and making informed decisions in clinical practice.
-
In Genetics
Geneticists often use the Chi-Square test to study inheritance patterns and genetic distributions. For example, they can test whether the observed distribution of a genetic trait fits the expected Mendelian inheritance ratios. This helps in understanding the genetic factors influencing various traits and diseases.
-
In Cryptanalysis
In cryptanalysis, the Chi-Square test is used to detect patterns in ciphertexts that might reveal information about the plaintext. By comparing the frequency distribution of ciphertext symbols with expected distributions, cryptanalysts can identify possible weaknesses in encryption algorithms.
-
In Bioinformatics
Bioinformaticians apply the Chi-Square test to analyze genetic data, such as determining the distribution of different genes within a population. This is crucial for identifying disease-associated genes and understanding their impact on health.
The Chi-Square test's ability to handle different types of categorical data and test various hypotheses makes it an essential tool across multiple disciplines. By providing insights into the relationships between variables, it aids in making data-driven decisions and advancing research in various fields.
Limitations and Considerations
The Chi-Square test is a powerful statistical tool, but it comes with several limitations and considerations that researchers should be aware of to ensure accurate results and interpretations.
- Sensitivity to Sample Size: The Chi-Square test is highly sensitive to the size of the sample. With very large samples, even small differences can appear statistically significant, potentially leading to misleading conclusions about the importance of an association. Conversely, small sample sizes can result in expected frequencies that are too low, violating the test's assumptions and potentially leading to Type I or Type II errors.
- Expected Frequency Assumption: One of the key assumptions of the Chi-Square test is that the expected frequency in each cell of a contingency table should be at least 5. If this condition is not met, the test results may not be valid. Researchers can sometimes address this by combining categories or using alternative statistical methods like Fisher's Exact Test for smaller sample sizes.
- Non-Causal Nature: The Chi-Square test can indicate an association between variables, but it does not imply causality. It merely shows that the variables are related in some way, without providing information about the direction or cause of this relationship. Further research and more complex statistical analyses are required to establish causal relationships.
- Applicability to Data Types: The Chi-Square test is suitable for categorical data, but using it with continuous or ordinal data without proper categorization can lead to incorrect conclusions. It is crucial to ensure that the data meets the requirements for the test.
- Interpretation of Results: While the test provides a p-value indicating the statistical significance of the observed association, it is important to consider the practical significance as well. Researchers should accompany the Chi-Square test with measures of effect size, such as Cramer's V or Phi coefficient, to understand the strength of the association and its practical implications.
- Complexity with Large Contingency Tables: When dealing with contingency tables with many categories, the analysis can become complex and harder to interpret. This complexity can obscure meaningful patterns and make it difficult to draw clear conclusions.
In summary, while the Chi-Square test is a versatile and widely used tool in statistical analysis, researchers must carefully consider its limitations and assumptions. Proper application and interpretation are essential to avoid misleading results and to draw meaningful conclusions from the data.
Practical Examples
Chi-Square tests are widely used in various fields to test hypotheses about the distribution of categorical data. Below are some practical examples illustrating the application of Chi-Square tests:
Example 1: Political Preferences
This example examines whether political preference (e.g., party affiliation) is independent of gender. A survey of 500 people is conducted, and the results are as follows:
| Gender | Party A | Party B | Party C | Total |
|---|---|---|---|---|
| Male | 120 | 100 | 80 | 300 |
| Female | 80 | 70 | 50 | 200 |
| Total | 200 | 170 | 130 | 500 |
The Chi-Square Test of Independence can be used to determine if there is a significant relationship between gender and political preference.
Example 2: Education Level and Gender
In this example, we explore whether education level is related to gender. A sample of 400 individuals is taken, with the following distribution:
| Gender | High School | Bachelor's | Master's | PhD | Total |
|---|---|---|---|---|---|
| Male | 50 | 70 | 30 | 10 | 160 |
| Female | 60 | 80 | 70 | 30 | 240 |
| Total | 110 | 150 | 100 | 40 | 400 |
A Chi-Square Test of Independence will help assess whether there is a significant association between gender and education level.
Example 3: Vaccine Efficacy by Age Group
This example investigates whether the efficacy of a vaccine is related to age group. The following data is collected from 300 participants:
| Age Group | Effective | Not Effective | Total |
|---|---|---|---|
| 18-29 | 70 | 30 | 100 |
| 30-49 | 60 | 40 | 100 |
| 50+ | 50 | 50 | 100 |
| Total | 180 | 120 | 300 |
The Chi-Square Test of Independence will determine if there is a statistically significant relationship between age group and vaccine efficacy.
Further Reading and Resources
To deepen your understanding of sample size and Chi-Square tests, explore the following resources:
-
Online Courses and Tutorials:
- : Comprehensive courses on statistical concepts including Chi-Square tests.
- : Free and paid courses offering in-depth tutorials on Chi-Square tests and more.
- : Video tutorials on Chi-Square tests and other statistical methods.
-
Books:
- Statistics for Dummies by Deborah J. Rumsey: A beginner-friendly guide to understanding statistical tests.
- The Cartoon Guide to Statistics by Larry Gonick and Woollcott Smith: A visual and engaging approach to learning statistics.
- Introduction to the Practice of Statistics by David S. Moore, George P. McCabe, and Bruce A. Craig: A comprehensive textbook covering Chi-Square tests and other statistical methods.
-
Research Articles and Papers:
- : Detailed research articles available on JSTOR.
- : Examples and explanations of Chi-Square tests in medical studies.
-
Software Tools:
- : Step-by-step guides to performing Chi-Square tests using SPSS software.
- : Guides on using R for conducting Chi-Square tests and other statistical analyses.
Video về kiểm tra Chi-Square và cách xác định kích thước mẫu phù hợp, giúp thu hút người xem và cải thiện hiểu biết của họ về các phương pháp thống kê.
Kiểm Tra Chi-Square và Kích Thước Mẫu
READ MORE:
Video về kiểm tra Chi-Square và cách xác định kích thước mẫu tối thiểu phù hợp, giúp thu hút người xem và cải thiện hiểu biết của họ về các phương pháp thống kê.
Kiểm Tra Chi-Square và Kích Thước Mẫu Tối Thiểu

:max_bytes(150000):strip_icc()/Chi-SquareStatistic_Final_4199464-7eebcd71a4bf4d9ca1a88d278845e674.jpg)