Topic chi-square null hypothesis: The chi-square null hypothesis plays a crucial role in statistical analysis, helping researchers determine if observed data deviates significantly from expected outcomes. This concept is fundamental in tests like the chi-square goodness of fit and chi-square test of independence, making it an essential tool for anyone involved in data science and research.
Table of Content
- Chi-Square Null Hypothesis
- Introduction to Chi-Square Test
- Understanding the Null Hypothesis
- Chi-Square Goodness of Fit Test
- Chi-Square Test of Independence
- Calculating Expected Values
- Chi-Square Statistic Formula
- Interpreting Chi-Square Results
- Common Misconceptions
- Assumptions and Limitations
- Effect Size Measures
- Applications of Chi-Square Test
- Frequently Asked Questions
- Conclusion and Further Reading
- YOUTUBE: Xem video này để hiểu về thống kê Chi-bình phương trong kiểm định giả thuyết, được giảng dạy bởi Khan Academy.
Chi-Square Null Hypothesis
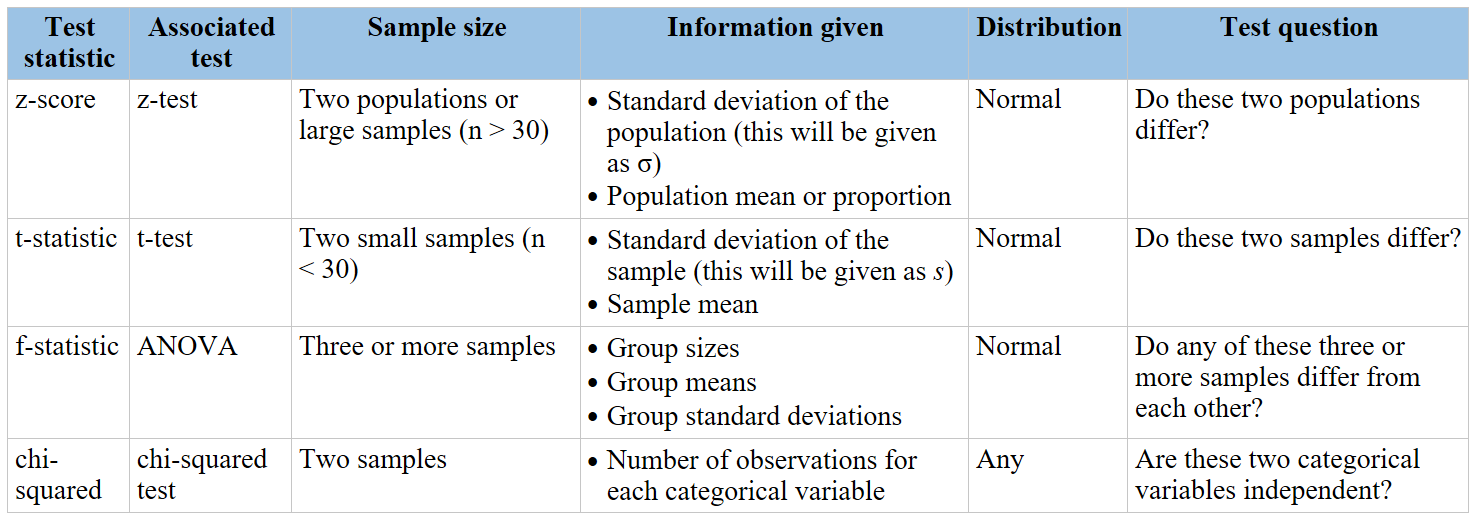
The chi-square test is a statistical method to determine if there is a significant association between categorical variables. It compares the observed frequencies of data with the expected frequencies based on the null hypothesis.
Types of Chi-Square Tests
- Chi-Square Goodness of Fit Test: Tests whether the distribution of a single categorical variable matches an expected distribution.
- Chi-Square Test of Independence: Assesses whether two categorical variables are independent or associated.
Steps to Perform a Chi-Square Test
- State the null hypothesis (\(H_0\)) and the alternative hypothesis (\(H_1\)).
- Example: \(H_0\): The distribution of categorical variable matches the expected distribution. \(H_1\): The distribution does not match the expected distribution.
- Calculate the expected frequencies for each category.
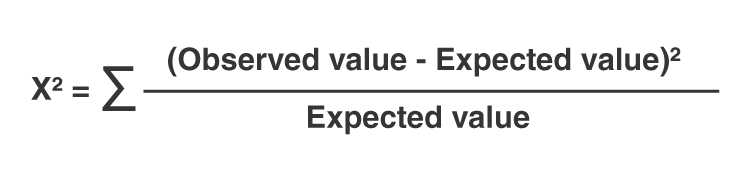
- Compute the chi-square statistic: \[ \chi^2 = \sum \frac{(O_i - E_i)^2}{E_i} \] where \(O_i\) is the observed frequency and \(E_i\) is the expected frequency.
- Determine the degrees of freedom (df): \[ df = (r - 1) \times (c - 1) \] where \(r\) is the number of rows and \(c\) is the number of columns.
- Compare the chi-square statistic to the critical value from the chi-square distribution table to determine the p-value.
- Make a decision: If the p-value is less than the significance level (\(\alpha\)), reject the null hypothesis.
Example Calculation
Suppose we want to test if gender is independent of education level in a sample of 395 individuals. The observed frequencies are:
| High School | Bachelors | Masters | Ph.D. | Total | |
| Female | 60 | 54 | 46 | 41 | 201 |
| Male | 40 | 44 | 53 | 57 | 194 |
| Total | 100 | 98 | 99 | 98 | 395 |
Calculate the expected frequencies:
| High School | Bachelors | Masters | Ph.D. | Total | |
| Female | 50.886 | 49.868 | 50.377 | 49.868 | 201 |
| Male | 49.114 | 48.132 | 48.623 | 48.132 | 194 |
| Total | 100 | 98 | 99 | 98 | 395 |
Calculate the chi-square statistic:
Compare the chi-square statistic to the critical value with 3 degrees of freedom at the 5% significance level (\(\chi^2_{0.05, 3} = 7.815\)). Since 8.006 > 7.815, we reject the null hypothesis and conclude that gender and education level are dependent.
READ MORE:
Introduction to Chi-Square Test
The chi-square test is a statistical method used to determine if there is a significant association between categorical variables. It is widely used in hypothesis testing to compare observed data with expected data under a specific null hypothesis. This test is applicable in various fields, including biology, medicine, and social sciences, to test relationships between categorical variables.
The two most common types of chi-square tests are the chi-square goodness of fit test and the chi-square test of independence.
Chi-Square Goodness of Fit Test
This test determines whether a sample data matches an expected distribution. It is used when you have one categorical variable from a single population. The null hypothesis states that the sample data fits a specified distribution, while the alternative hypothesis states that the sample data does not fit the distribution.
- Define the null and alternative hypotheses.
- Calculate the expected frequencies for each category.
- Use the chi-square formula: \( \chi^2 = \sum \frac{(O_i - E_i)^2}{E_i} \), where \( O_i \) is the observed frequency and \( E_i \) is the expected frequency.
- Determine the degrees of freedom: number of categories minus one.
- Compare the calculated chi-square statistic to the critical value from the chi-square distribution table.
- Make a decision to reject or fail to reject the null hypothesis.
Chi-Square Test of Independence
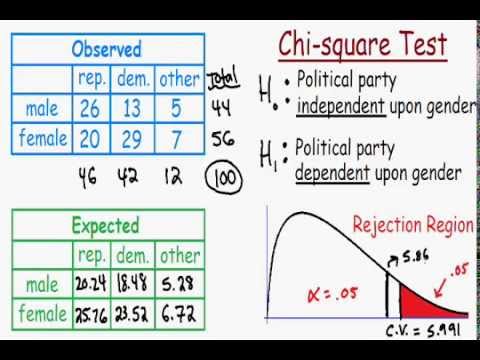
This test assesses whether two categorical variables are independent. It is used when you have two categorical variables from a single population. The null hypothesis states that the variables are independent, while the alternative hypothesis states that the variables are dependent.
- Define the null and alternative hypotheses.
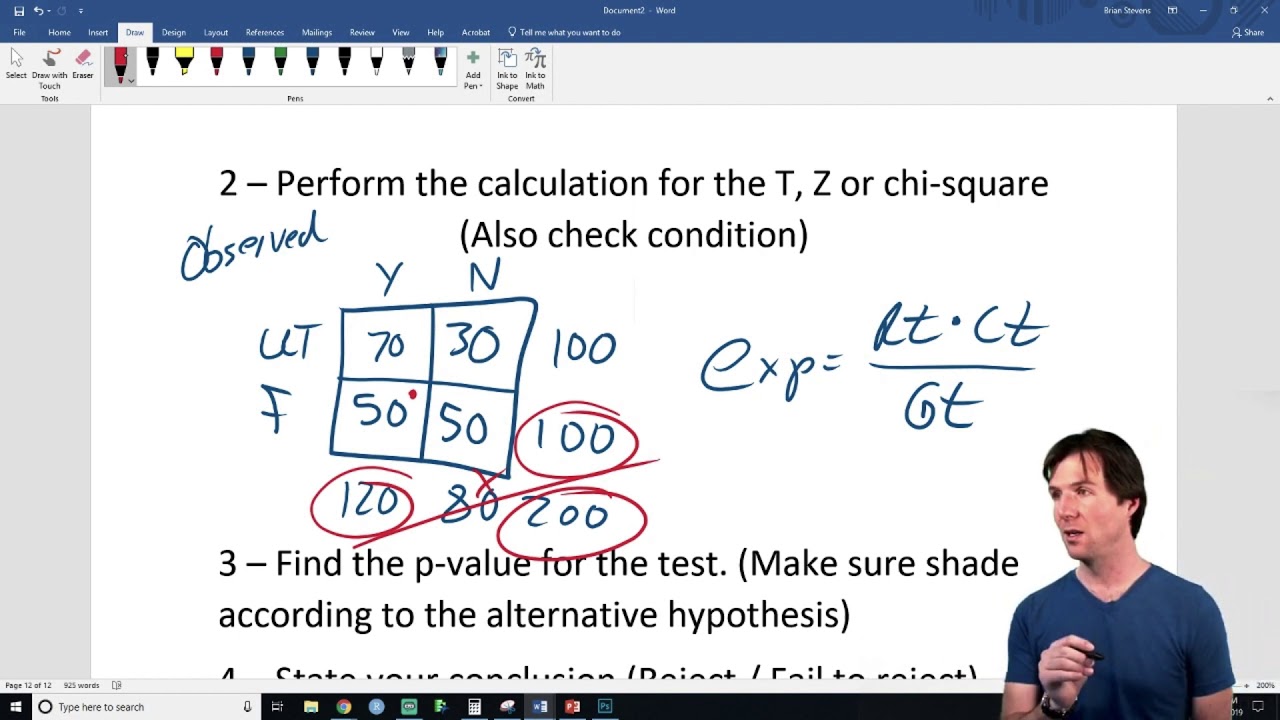
- Construct a contingency table of observed frequencies.
- Calculate the expected frequencies for each cell in the table using the formula: \( E_{ij} = \frac{(Row \, Total) \times (Column \, Total)}{Grand \, Total} \).
- Use the chi-square formula: \( \chi^2 = \sum \frac{(O_{ij} - E_{ij})^2}{E_{ij}} \), where \( O_{ij} \) is the observed frequency and \( E_{ij} \) is the expected frequency.
- Determine the degrees of freedom: (number of rows - 1) * (number of columns - 1).
- Compare the calculated chi-square statistic to the critical value from the chi-square distribution table.
- Make a decision to reject or fail to reject the null hypothesis.
The chi-square test is a valuable tool for analyzing categorical data and can provide insights into the relationships between variables. Proper application of this test involves careful calculation of expected frequencies and understanding the limitations of the chi-square distribution.
Understanding the Null Hypothesis
The null hypothesis in a chi-square test is a fundamental concept in statistics. It posits that there is no significant association between the categorical variables being studied. Essentially, it assumes that any observed difference between the variables is due to random chance.
To perform a chi-square test, follow these steps:
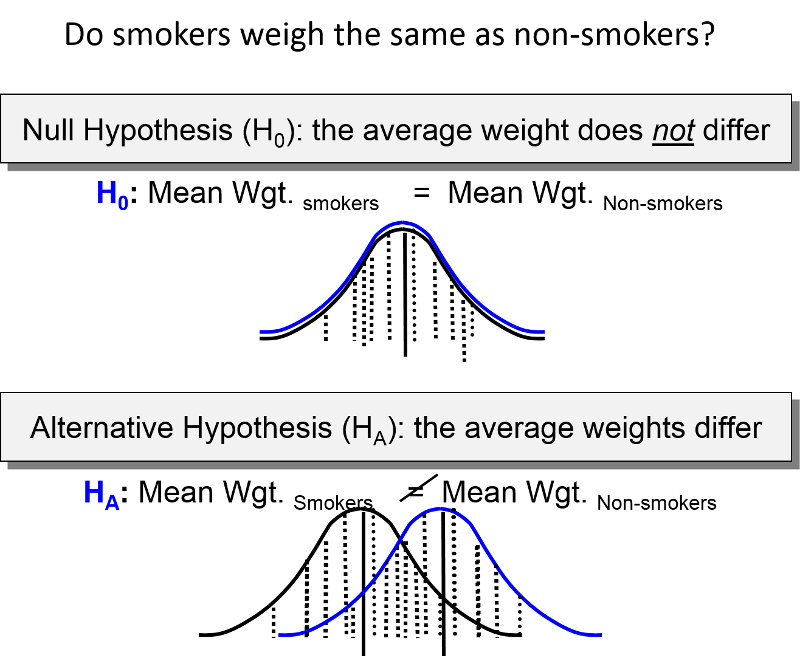
- Formulate the Hypotheses:
- Null Hypothesis (H0): The variables are independent, meaning no association exists between them.
- Alternative Hypothesis (H1): The variables are not independent, indicating a significant association.
- Create a Contingency Table: Construct a table to display the frequency distribution of the variables.
- Calculate Expected Frequencies: For each cell in the table, calculate the expected frequency using the formula: \[ E = \frac{(\text{Row Total}) \times (\text{Column Total})}{\text{Grand Total}} \]
- Compute the Chi-Square Statistic: Use the formula: \[ \chi^2 = \sum \frac{(O - E)^2}{E} \] where \( O \) is the observed frequency and \( E \) is the expected frequency.
- Determine the Degrees of Freedom: Calculate the degrees of freedom (df) as: \[ \text{df} = (\text{number of rows} - 1) \times (\text{number of columns} - 1) \]
- Find the Critical Value: Compare the chi-square statistic to the critical value from the chi-square distribution table at the chosen significance level (usually 0.05).
- Draw a Conclusion:
- If the chi-square statistic is greater than the critical value, reject the null hypothesis, indicating a significant association between the variables.
- If the chi-square statistic is less than the critical value, fail to reject the null hypothesis, indicating no significant association.
Understanding the null hypothesis and its role in the chi-square test is crucial for correctly interpreting statistical data and making informed decisions based on the analysis.
Chi-Square Goodness of Fit Test
The Chi-Square Goodness of Fit Test is used to determine if a sample data matches a population with a specific distribution. This test is applied to a categorical variable to see if the observed frequency distribution differs significantly from the expected distribution specified by the null hypothesis.
Steps to Perform the Test
-
Set up the Hypotheses:
- Null Hypothesis (\(H_0\)): The sample data fits the specified distribution.
- Alternative Hypothesis (\(H_a\)): The sample data does not fit the specified distribution.
-
Determine the Expected Frequencies: Calculate the expected frequency for each category using \(E = np\), where \(n\) is the total number of observations and \(p\) is the probability of the category as specified in the null hypothesis.
-
Calculate the Test Statistic: Use the formula \(\chi^2 = \sum \frac{(O - E)^2}{E}\) where \(O\) is the observed frequency and \(E\) is the expected frequency.
-
Determine the Degrees of Freedom: The degrees of freedom for this test is \(df = k - 1\), where \(k\) is the number of categories.
-
Compare to the Critical Value: Compare the calculated chi-square statistic to the critical value from the chi-square distribution table with the determined degrees of freedom. If the test statistic exceeds the critical value, reject the null hypothesis.
Example
Consider a company that claims their distribution of card types is 30% rookies, 60% veterans, and 10% all-stars. A random sample of 100 cards showed 25 rookies, 60 veterans, and 15 all-stars. We can use the chi-square goodness of fit test to determine if the sample distribution significantly differs from the claimed distribution.
| Category | Observed (O) | Expected (E) | (O - E) | (O - E)2 | \(\frac{(O - E)^2}{E}\) |
| Rookies | 25 | 30 | -5 | 25 | 0.83 |
| Veterans | 60 | 60 | 0 | 0 | 0 |
| All-Stars | 15 | 10 | 5 | 25 | 2.5 |
| Total \(\chi^2\) Value: | 3.33 | ||||
The degrees of freedom are \(df = 3 - 1 = 2\). Using a chi-square distribution table, we find the critical value at the 0.05 significance level is 5.99. Since 3.33 < 5.99, we fail to reject the null hypothesis, indicating that the sample distribution does not significantly differ from the claimed distribution.
Chi-Square Test of Independence
The Chi-Square Test of Independence is used to determine if there is a significant association between two categorical variables. It helps in understanding whether the distribution of one variable is independent of the distribution of another variable. Here's a step-by-step explanation of how this test is conducted:
-
State the Hypotheses:
- Null Hypothesis (\(H_0\)): The two variables are independent.
- Alternative Hypothesis (\(H_A\)): The two variables are not independent.
-
Create a Contingency Table:
Organize the data into a table that displays the frequency of occurrences for each combination of the variables.
Variable B1 Variable B2 Total Variable A1 Observed (O11) Observed (O12) Row Total Variable A2 Observed (O21) Observed (O22) Row Total Total Column Total Column Total Grand Total (N) -
Calculate Expected Frequencies:
The expected frequency for each cell is calculated using the formula:
\[
E_{ij} = \frac{(Row\ Total_i \times Column\ Total_j)}{N}
\]Variable B1 Variable B2 Total Variable A1 Expected (E11) Expected (E12) Row Total Variable A2 Expected (E21) Expected (E22) Row Total Total Column Total Column Total Grand Total (N) -
Compute the Chi-Square Statistic:
The test statistic is calculated using the formula:
\[
\chi^2 = \sum \frac{(O_{ij} - E_{ij})^2}{E_{ij}}
\] -
Determine the Degrees of Freedom:
The degrees of freedom (df) are calculated as:
\[
df = (number\ of\ rows - 1) \times (number\ of\ columns - 1)
\] -
Find the P-Value:
Using the chi-square distribution table, find the p-value corresponding to the calculated chi-square statistic and degrees of freedom.
-
Make a Decision:
Compare the p-value to the significance level (α). If the p-value is less than α, reject the null hypothesis, indicating that the variables are not independent.
The Chi-Square Test of Independence is a powerful tool in statistical analysis for examining the relationship between two categorical variables.
Calculating Expected Values
To calculate expected values for a Chi-Square test, follow these steps:
- Understand Expected Frequencies: Expected values (Ei) represent the frequencies that would be expected in each category of a contingency table if the null hypothesis (H0) were true.
- Use Total Frequencies: Calculate row totals (Ri) and column totals (Cj) from the observed data to derive expected values.
- Compute Expected Frequency for Each Cell: Calculate each expected frequency using the formula:
Where Ri is the total count of observations in row i, Cj is the total count of observations in column j, and N is the total sample size.Eij = (Ri * Cj) / N - Apply for Contingency Table: Repeat the calculation for each cell in the contingency table to determine the expected frequencies under the assumption of independence between row and column variables.
Chi-Square Statistic Formula
The Chi-Square statistic formula is used to measure the discrepancy between observed and expected frequencies in a Chi-Square test. Here’s how you calculate it:
- Calculate the Chi-Square Statistic:
| χ2 = Σ [(Oi - Ei)2 / Ei] |
Where:
- χ2 is the Chi-Square statistic.
- Oi is the observed frequency in category i.
- Ei is the expected frequency in category i under the null hypothesis.
- Σ indicates a sum over all categories.
Interpreting Chi-Square Results
Interpreting Chi-Square results involves several key steps to understand the significance and implications of the test:
- Compare Chi-Square Statistic: Compare the calculated Chi-Square statistic (χ2) to the critical value from the Chi-Square distribution table or the p-value obtained from statistical software.
- Consider Degrees of Freedom: Take into account the degrees of freedom (df), which depend on the dimensions of the contingency table (df = (rows - 1) * (columns - 1)).
- Check Significance Level: Determine the significance level (α) used for the test (commonly α = 0.05 or α = 0.01) to decide whether to reject the null hypothesis (H0).
- Reject or Fail to Reject Null Hypothesis: If χ2 > critical value or if p < α, reject H0, indicating evidence of a significant relationship between variables. If not, fail to reject H0, suggesting no significant relationship.
- Provide Interpretation: Interpret the results in the context of the research question. Describe the nature and strength of the relationship found based on the Chi-Square test.
- Consider Limitations: Be mindful of any assumptions or limitations of the Chi-Square test that may affect the interpretation of results, such as sample size or data distribution.
Common Misconceptions
Addressing common misconceptions about Chi-Square tests can clarify understanding:
- Chi-Square Indicates Causation: Chi-Square tests assess associations, not causation. A significant result does not imply one variable causes changes in another.
- Applicability to Continuous Data: Chi-Square tests are suitable for categorical data, not continuous variables. Misapplying it to continuous data can yield incorrect results.
- Sample Size and Significance: Larger sample sizes may yield statistically significant results even with small effect sizes, which could lead to misinterpretation.
- Assumption of Independence: Chi-Square tests assume variables are independent. Violating this assumption can invalidate the test results.
- Interpretation of Expected Values: Expected values in Chi-Square tests are theoretical and do not necessarily represent actual occurrences.
- Alternative Hypothesis (Ha) Misconception: Ha in Chi-Square tests typically suggests a difference exists, not necessarily a specific direction or nature of that difference.
Assumptions and Limitations
Understanding the assumptions and limitations of Chi-Square tests is crucial for accurate interpretation:
- Independence: Chi-Square tests assume that observations are independent. Violations of this assumption can lead to biased results.
- Sample Size: While Chi-Square tests are robust with large sample sizes, small sample sizes may yield unreliable results or inaccurate interpretation of significance.
- Categorical Data: Chi-Square tests are appropriate for categorical data. Using it with continuous data can result in incorrect conclusions.
- Expected Frequencies: Expected frequencies should generally be 5 or more for reliable results. Lower expected frequencies can lead to unreliable Chi-Square values.
- Validity of Null Hypothesis: The accuracy of Chi-Square test results depends on the appropriateness of the null hypothesis (H0). A poorly formulated H0 can lead to misleading conclusions.
- Interpretation of Results: Chi-Square tests indicate association, not causation. Thus, results should be interpreted cautiously to avoid misattributing relationships.
Effect Size Measures
Effect size measures in Chi-Square tests help to quantify the strength of association between variables:
- Cramér's V: Cramér's V is a commonly used measure of association for Chi-Square tests, calculated as:
| V = √(χ2 / N * (min(C, R) - 1)) |
Where:
- V is Cramér's V.
- χ2 is the Chi-Square statistic.
- N is the total sample size.
- C is the number of columns in the contingency table.
- R is the number of rows in the contingency table.
Applications of Chi-Square Test
The Chi-Square test finds diverse applications in various fields for analyzing categorical data:
- Medical Research: Assessing the association between treatment outcomes and patient characteristics.
- Market Research: Examining consumer preferences and behaviors based on demographic categories.
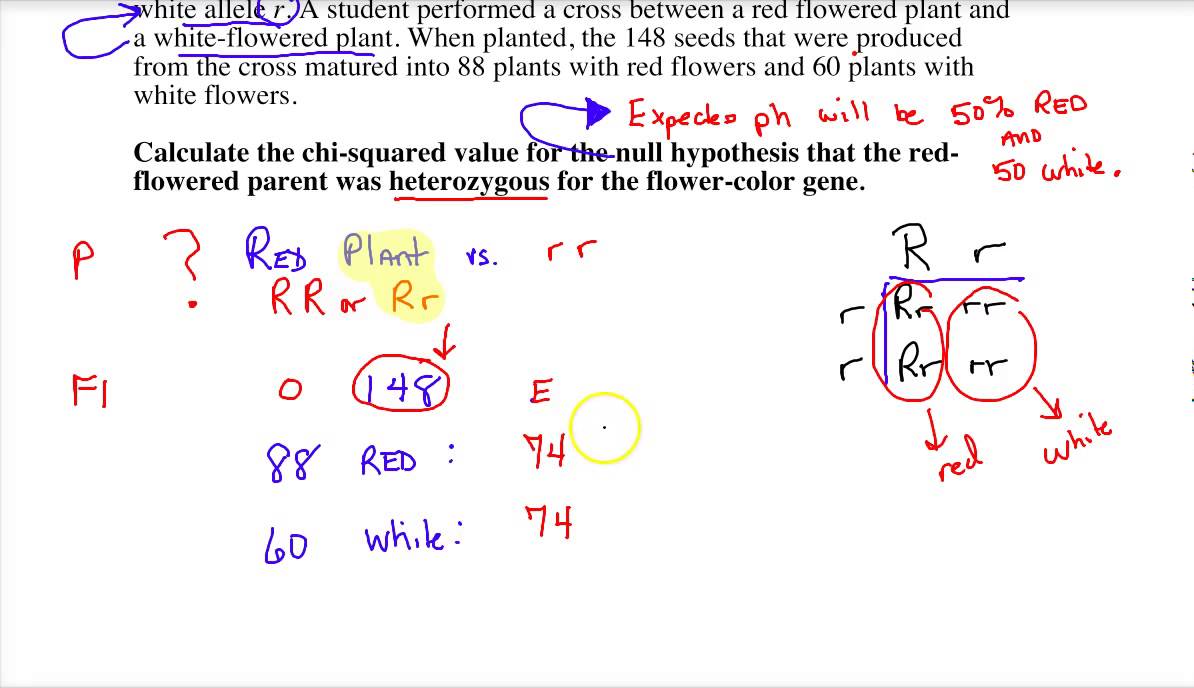
- Biology: Studying genetics to understand the distribution of traits across different populations.
- Social Sciences: Investigating relationships between variables such as education level and political preferences.
- Quality Control: Analyzing defect rates across different production lines or processes.
- Epidemiology: Investigating the relationship between exposure to risk factors and disease occurrence.
- Education: Evaluating the effectiveness of teaching methods or interventions across student groups.
- Environmental Studies: Assessing the impact of environmental factors on species distribution or habitat preferences.
Frequently Asked Questions
- What is a Chi-Square test?
A Chi-Square test is a statistical method used to determine if there is a significant association between categorical variables.
- What does the null hypothesis (H0) in a Chi-Square test state?
The null hypothesis states that there is no significant difference between the observed and expected frequencies in the population.
- When should I use a Chi-Square test?
Use a Chi-Square test when you have categorical data and want to determine if there is a relationship or association between variables.
- How do I interpret the Chi-Square test results?
Interpret the results by comparing the calculated Chi-Square statistic to the critical value or by examining the p-value. If the Chi-Square statistic is greater than the critical value or the p-value is less than your chosen significance level (typically 0.05), you reject the null hypothesis.
- What are the assumptions of the Chi-Square test?
The main assumptions include: 1) categorical data, 2) independence of observations, 3) expected frequencies should be greater than 5 for reliable results.
- Can Chi-Square test show causation?
No, Chi-Square tests only show associations or relationships between variables, not causation.
- What is Cramér's V and when is it used?
Cramér's V is a measure of association used in Chi-Square tests to determine the strength of the relationship between categorical variables. It ranges from 0 to 1, where 0 indicates no association and 1 indicates a strong association.
Conclusion and Further Reading
Understanding the Chi-Square test and its implications regarding the null hypothesis is crucial in various statistical analyses. Here's a summary:
- The Chi-Square test evaluates the independence or goodness of fit of observed data to expected data.
- The null hypothesis in Chi-Square tests states that there is no significant difference between the observed and expected frequencies.
- Types of Chi-Square tests include the Chi-Square goodness of fit test and the Chi-Square test of independence.
- Interpreting Chi-Square results involves comparing the calculated Chi-Square statistic with critical values from the Chi-Square distribution.
- Common misconceptions include misinterpretations of statistical significance and assumptions violations.
- Further reading on Chi-Square tests can deepen your understanding of statistical hypothesis testing.
For more detailed exploration, you can refer to the following resources:
- Stat Trek's comprehensive guide on Chi-Square tests and null hypothesis (https://stattrek.com/statistics/dictionary.aspx?definition=Chi-square_test).
- ResearchGate articles on practical applications and case studies using Chi-Square tests (https://www.researchgate.net/search/publication?q=chi-square%20null%20hypothesis).
- Academic papers on advanced topics like effect size measures and robustness of Chi-Square tests (use academic databases like JSTOR or Google Scholar).
Xem video này để hiểu về thống kê Chi-bình phương trong kiểm định giả thuyết, được giảng dạy bởi Khan Academy.
Video "Thống kê Chi-bình phương cho kiểm định giả thuyết | Thống kê AP | Khan Academy"
READ MORE:
Xem video này để hiểu về phương pháp kiểm định Chi-bình phương trong thống kê và ứng dụng của nó trong phân tích giả thuyết rỗng.
Video "Kiểm định Chi-bình phương"
:max_bytes(150000):strip_icc()/Chi-SquareStatistic_Final_4199464-7eebcd71a4bf4d9ca1a88d278845e674.jpg)