Topic null hypothesis for chi square: The null hypothesis for chi-square is crucial in determining the association between categorical variables. This comprehensive guide will help you understand how to formulate, calculate, and interpret the null hypothesis, enhancing your statistical analysis skills. Dive into the details and applications of chi-square tests in various fields, from research to business and medicine.
Table of Content
- Null Hypothesis for Chi-Square Test
- Introduction to Chi-Square Test
- Understanding the Null Hypothesis
- Types of Chi-Square Tests
- Calculating Expected Frequencies
- Conducting the Chi-Square Test
- Interpreting Results
- Applications of Chi-Square Test
- Advantages and Limitations
- YOUTUBE: Video hướng dẫn về kiểm tra Chi-Square và cách hiểu giả thuyết không trong kiểm tra Chi-Square.
Null Hypothesis for Chi-Square Test
The chi-square test is a statistical method used to determine if there is a significant association between two categorical variables. It is commonly used in hypothesis testing to evaluate whether the observed data deviates significantly from what would be expected under the null hypothesis.
Definition of Null Hypothesis
In the context of the chi-square test, the null hypothesis (H0) is a statement that there is no association between the variables being studied. This means that any observed difference between the categories is due to random chance.
Mathematically, the null hypothesis for a chi-square test can be expressed as:
H0: \(\sum \left( \frac{(O_i - E_i)^2}{E_i} \right)\) follows a chi-square distribution with k-1 degrees of freedom
Where:
- Oi = Observed frequency in each category
- Ei = Expected frequency in each category
- k = Number of categories
Formulating the Null Hypothesis
When formulating the null hypothesis for a chi-square test, consider the following steps:
- Identify the variables: Determine the categorical variables that you want to test for independence or goodness of fit.
- Specify the null hypothesis: State that there is no significant association between the variables. For example, in a test of independence, H0 might be "Gender and preference for a product are independent."
- Determine the expected frequencies: Calculate the expected frequencies for each category under the assumption that the null hypothesis is true.
- Conduct the chi-square test: Calculate the chi-square statistic and compare it to the critical value from the chi-square distribution table. If the calculated statistic is greater than the critical value, reject the null hypothesis.
Conclusion
The null hypothesis for a chi-square test serves as the baseline assumption that there is no relationship between the categorical variables being tested. By comparing the observed data to the expected data under the null hypothesis, researchers can determine if there is enough evidence to reject the null hypothesis and conclude that a significant association exists.
:max_bytes(150000):strip_icc()/Chi-SquareStatistic_Final_4199464-7eebcd71a4bf4d9ca1a88d278845e674.jpg)
READ MORE:
Introduction to Chi-Square Test
The chi-square test is a statistical method used to examine the relationship between categorical variables. It assesses whether observed frequencies in different categories differ significantly from expected frequencies derived from a particular hypothesis. This test is widely used in research, social sciences, and various other fields to test hypotheses about distributions of categorical data.
There are two main types of chi-square tests:
- Chi-Square Test for Independence: This test determines if there is a significant association between two categorical variables. For example, it can be used to assess whether gender is related to preference for a specific product.
- Chi-Square Test for Goodness of Fit: This test compares an observed distribution with an expected distribution to see if they differ. It is useful for determining if a sample comes from a population with a specific distribution.
The chi-square test follows these general steps:
- State the hypotheses: Formulate the null hypothesis (H0) which states that there is no association between the variables, and the alternative hypothesis (H1) which states that there is an association.
- Calculate expected frequencies: Based on the null hypothesis, calculate the expected frequencies for each category.
- Compute the chi-square statistic: Use the formula:
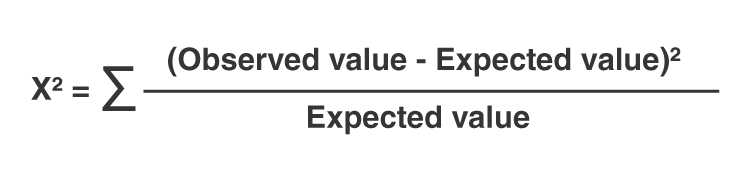
\(\chi^2 = \sum \frac{(O_i - E_i)^2}{E_i}\)
where Oi is the observed frequency and Ei is the expected frequency. - Determine the degrees of freedom: Calculate the degrees of freedom for the test. For the test of independence, it is given by:
(r-1)(c-1)
where r is the number of rows and c is the number of columns in the contingency table. - Compare with critical value: Compare the computed chi-square statistic to the critical value from the chi-square distribution table at a specific significance level (e.g., 0.05). If the statistic exceeds the critical value, reject the null hypothesis.
The chi-square test is a powerful tool for analyzing categorical data and can provide valuable insights into the relationships between variables. Its applications span numerous fields, making it an essential method in statistical analysis.
Understanding the Null Hypothesis
The null hypothesis, denoted as H0, is a fundamental concept in statistical hypothesis testing. In the context of the chi-square test, the null hypothesis states that there is no significant association between the categorical variables being studied. It assumes that any observed differences between categories are due to random chance.
The null hypothesis serves as a starting point for statistical testing. By assuming no effect or no relationship, it provides a benchmark against which the observed data can be compared. Here are the steps to understand and formulate the null hypothesis in a chi-square test:
- Identify the variables: Determine the categorical variables you want to test. For example, you might want to test whether gender (male, female) is independent of preference for a product (like, dislike).
- State the null hypothesis: Formulate the null hypothesis to state that there is no association between the variables. For instance, H0: "Gender and product preference are independent."
- Determine the expected frequencies: Calculate the expected frequencies for each category assuming the null hypothesis is true. The expected frequency for each cell in a contingency table is calculated as:
E_{ij} = \frac{(row \, total \times column \, total)}{grand \, total}
- Calculate the chi-square statistic: Compute the chi-square statistic using the formula:
\(\chi^2 = \sum \frac{(O_i - E_i)^2}{E_i}\)
where Oi represents the observed frequency, and Ei represents the expected frequency. - Compare with critical value: Compare the calculated chi-square statistic to the critical value from the chi-square distribution table, considering the degrees of freedom, which is given by:
(r-1)(c-1)
where r is the number of rows and c is the number of columns in the table. - Make a decision: If the chi-square statistic exceeds the critical value at a chosen significance level (e.g., 0.05), reject the null hypothesis. Otherwise, fail to reject the null hypothesis, implying no significant association between the variables.
Understanding the null hypothesis is crucial for interpreting the results of a chi-square test. It helps researchers determine whether observed data patterns are statistically significant or likely due to chance, guiding decision-making and hypothesis validation.
Types of Chi-Square Tests
The chi-square test is a versatile statistical tool used to evaluate relationships between categorical variables. There are two primary types of chi-square tests: the chi-square test for independence and the chi-square test for goodness of fit. Each type serves a different purpose and follows a specific methodology.
Chi-Square Test for Independence
The chi-square test for independence assesses whether two categorical variables are independent of each other. This test is often used in contingency tables to determine if the distribution of one variable differs significantly across the levels of another variable. Here are the steps to conduct this test:
- Formulate the hypotheses:
- Null hypothesis (H0): The two variables are independent.
- Alternative hypothesis (H1): The two variables are not independent.
- Create a contingency table: Arrange the observed frequencies of the categorical variables in a table format.
- Calculate expected frequencies: Compute the expected frequencies for each cell of the table using the formula:
E_{ij} = \frac{(row \, total_i \times column \, total_j)}{grand \, total}
- Compute the chi-square statistic: Use the formula:
\(\chi^2 = \sum \frac{(O_i - E_i)^2}{E_i}\)
where Oi is the observed frequency, and Ei is the expected frequency. - Determine the degrees of freedom: Calculate the degrees of freedom as:
(r-1)(c-1)
where r is the number of rows and c is the number of columns in the contingency table. - Compare with the critical value: Compare the chi-square statistic to the critical value from the chi-square distribution table at the chosen significance level (e.g., 0.05). If the statistic exceeds the critical value, reject the null hypothesis.
Chi-Square Test for Goodness of Fit
The chi-square test for goodness of fit determines whether an observed frequency distribution matches an expected distribution. This test is useful for assessing how well a sample fits a population distribution. Here are the steps to conduct this test:
- Formulate the hypotheses:
- Null hypothesis (H0): The observed frequencies fit the expected distribution.
- Alternative hypothesis (H1): The observed frequencies do not fit the expected distribution.
- Calculate expected frequencies: Determine the expected frequencies for each category based on the hypothesized distribution. For example, if testing a fair six-sided die, each face is expected to appear with a probability of \(\frac{1}{6}\).
- Compute the chi-square statistic: Use the same formula:
\(\chi^2 = \sum \frac{(O_i - E_i)^2}{E_i}\)
- Determine the degrees of freedom: Calculate the degrees of freedom as the number of categories minus one:
k-1
- Compare with the critical value: Compare the chi-square statistic to the critical value from the chi-square distribution table. If the statistic exceeds the critical value, reject the null hypothesis.
Both types of chi-square tests are essential for analyzing categorical data, helping researchers and analysts understand the relationships and distributions within their data.
Calculating Expected Frequencies
Calculating the expected frequencies is a crucial step in performing a chi-square test. Expected frequencies represent the counts we would expect in each category if the null hypothesis were true. Here's a step-by-step guide on how to calculate them:
- Set Up a Contingency Table:
Organize your observed data in a contingency table. For example, if you are examining the relationship between gender (male, female) and voting preference (candidate A, candidate B), your table might look like this:
Candidate A Candidate B Total Male O11 O12 Row Total 1 Female O21 O22 Row Total 2 Total Column Total 1 Column Total 2 Grand Total - Calculate Row and Column Totals:
Sum the observed frequencies across rows and columns to get the row and column totals, as well as the grand total of all observations.
- Use the Expected Frequency Formula:
For each cell in the contingency table, calculate the expected frequency using the formula:
E_{ij} = \frac{(row \, total_i \times column \, total_j)}{grand \, total}
Where:
- Eij = Expected frequency for the cell in row i and column j
- row totali = Total frequency for row i
- column totalj = Total frequency for column j
- grand total = Sum of all frequencies
- Calculate for Each Cell:
Apply the formula to each cell in the contingency table. For example:
- For the cell in the first row and first column (E11):
- For the cell in the first row and second column (E12):
- Repeat for all other cells in the table.
E_{11} = \frac{(row \, total_1 \times column \, total_1)}{grand \, total}
E_{12} = \frac{(row \, total_1 \times column \, total_2)}{grand \, total}
- Verify Totals:
Ensure that the sum of the expected frequencies for each row and column matches the respective row and column totals. The sum of all expected frequencies should equal the grand total.
Calculating expected frequencies accurately is essential for the validity of the chi-square test. These calculations allow for a meaningful comparison between the observed and expected data, facilitating the determination of whether the null hypothesis can be rejected.
Conducting the Chi-Square Test
The chi-square test is a statistical method used to determine if there is a significant association between categorical variables. Follow these steps to conduct a chi-square test:
- Formulate Hypotheses:
- Null hypothesis (H0): There is no association between the variables.
- Alternative hypothesis (H1): There is an association between the variables.
- Create a Contingency Table:
Organize the observed data into a contingency table. For example, if studying the relationship between gender (male, female) and preference for a product (yes, no), the table might look like this:
Yes No Total Male O11 O12 Row Total 1 Female O21 O22 Row Total 2 Total Column Total 1 Column Total 2 Grand Total - Calculate Expected Frequencies:
Compute the expected frequency for each cell using the formula:
E_{ij} = \frac{(row \, total_i \times column \, total_j)}{grand \, total}
Where:
- Eij = Expected frequency for cell in row i and column j
- row totali = Total frequency for row i
- column totalj = Total frequency for column j
- grand total = Sum of all frequencies
- Compute the Chi-Square Statistic:
Use the observed and expected frequencies to calculate the chi-square statistic with the formula:
\(\chi^2 = \sum \frac{(O_i - E_i)^2}{E_i}\)
Where:
- Oi = Observed frequency for each category
- Ei = Expected frequency for each category
- Determine Degrees of Freedom:
Calculate the degrees of freedom for the test as:
(r-1)(c-1)
Where:
- r = Number of rows
- c = Number of columns
- Find the Critical Value:
Refer to the chi-square distribution table to find the critical value at the chosen significance level (e.g., 0.05) with the calculated degrees of freedom.
- Compare the Chi-Square Statistic to the Critical Value:
If the chi-square statistic is greater than the critical value, reject the null hypothesis. This suggests that there is a significant association between the variables. If the statistic is less than or equal to the critical value, do not reject the null hypothesis.
- Interpret the Results:
Based on the comparison, draw conclusions about the relationship between the variables. A significant result indicates a likely association, while a non-significant result suggests independence.
Conducting the chi-square test carefully and accurately is essential for deriving meaningful conclusions from categorical data. This step-by-step process ensures a thorough examination of the relationship between the variables under study.
Interpreting Results
Interpreting the results of a chi-square test is a critical step in understanding the relationship between categorical variables. Here is a detailed guide on how to interpret the results step by step:
- Compare Chi-Square Statistic to Critical Value:
After calculating the chi-square statistic and finding the critical value from the chi-square distribution table, compare the two:
- If \(\chi^2_{calculated} > \chi^2_{critical}\), reject the null hypothesis (H0).
- If \(\chi^2_{calculated} \leq \chi^2_{critical}\), do not reject the null hypothesis.
- Determine the P-Value:
The p-value indicates the probability of observing the data, or something more extreme, assuming the null hypothesis is true. Use a chi-square distribution table or statistical software to find the p-value corresponding to the calculated chi-square statistic and the degrees of freedom.
- If the p-value < 0.05 (or your chosen significance level), reject the null hypothesis.
- If the p-value ≥ 0.05, do not reject the null hypothesis.
- Draw Conclusions:
Based on the comparison and the p-value, draw conclusions about the relationship between the variables:
- Rejecting the null hypothesis: This suggests a significant association between the variables, indicating that the observed frequencies significantly differ from the expected frequencies under the null hypothesis.
- Not rejecting the null hypothesis: This suggests no significant association between the variables, indicating that the observed frequencies do not significantly differ from the expected frequencies under the null hypothesis.
- Assess Practical Significance:
Even if the result is statistically significant, consider the practical significance of the findings. Assess the strength and relevance of the association in the context of the research question and the practical implications of the results.
- Report the Results:
When reporting the results, include the following information:
- The chi-square statistic value
- The degrees of freedom
- The p-value
- The conclusion regarding the null hypothesis
- A discussion of the practical significance and implications of the findings
For example:
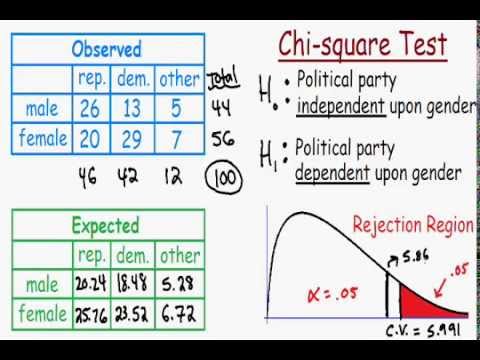
"A chi-square test of independence was conducted to examine the relationship between gender and voting preference. The test was significant, \(\chi^2 (1, N = 100) = 5.89, p < 0.05\), indicating that there is a significant association between gender and voting preference."
Interpreting the results of a chi-square test involves comparing the chi-square statistic to the critical value, determining the p-value, drawing conclusions, assessing practical significance, and reporting the findings comprehensively. This thorough interpretation ensures a clear understanding of the data and its implications.
Applications of Chi-Square Test
The Chi-Square Test is a versatile statistical tool used in various fields to test hypotheses about the relationships between categorical variables. Here are some of the key applications:
In Research
Researchers across different domains use the Chi-Square Test to analyze categorical data and determine if there are significant associations between variables.
- Sociology: In sociological studies, the test is used to examine the relationship between demographic variables, such as gender and educational attainment, or political affiliation and voting behavior.
- Psychology: Psychologists might use it to investigate if certain behaviors are associated with different demographic groups, such as the correlation between age groups and stress levels.
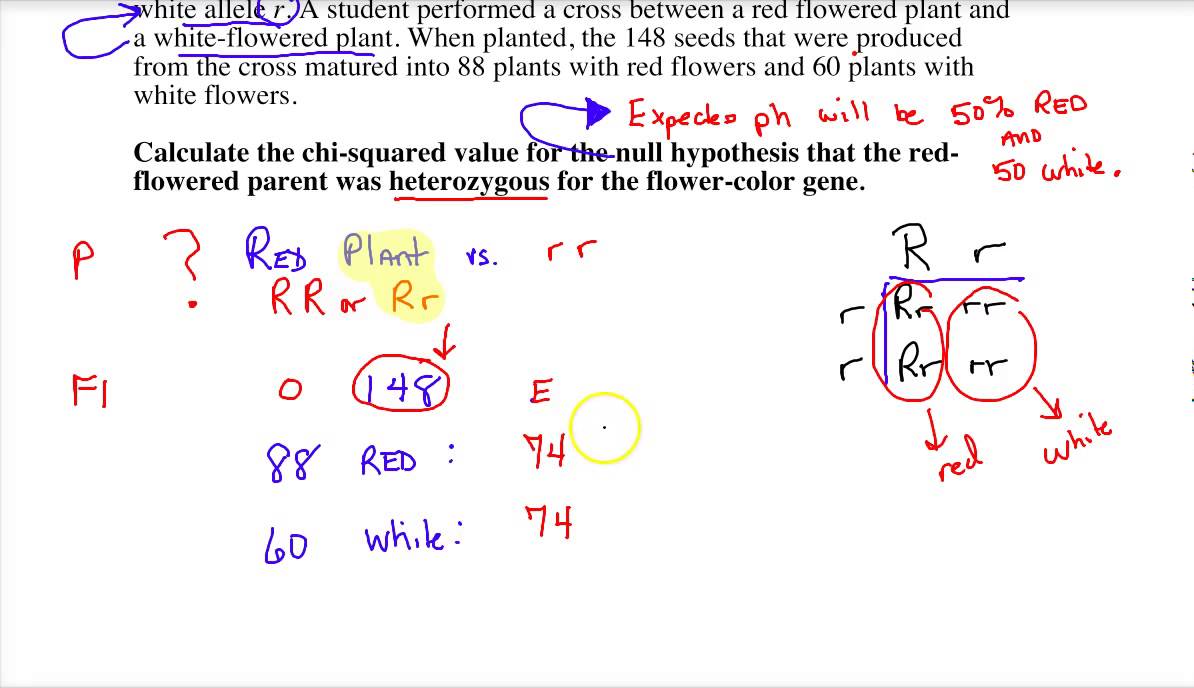
- Biology: Biologists use the Chi-Square Test for genetic studies, such as testing the expected distribution of phenotypes in offspring according to Mendelian inheritance patterns.
In Business
Businesses apply the Chi-Square Test to make data-driven decisions and improve their operations and strategies.
- Marketing: Companies can use the test to analyze consumer preferences and behaviors. For instance, a company might test if there is a significant difference in the preference for a product between different age groups or regions.
- Quality Control: In manufacturing, the test helps in quality control processes to determine if the number of defective products is within the expected range or if there are significant deviations that need addressing.
- Human Resources: The test can be used to evaluate if employee satisfaction is independent of department or job role, helping in organizational development and policy-making.
In Medicine
Medical researchers and practitioners use the Chi-Square Test to understand the relationships between categorical variables in healthcare settings.
- Epidemiology: It is used to study the association between risk factors and health outcomes, such as the link between smoking and lung cancer incidence.
- Clinical Trials: The test helps in comparing the effectiveness of different treatments by evaluating if there is a significant difference in recovery rates between groups receiving different interventions.
- Public Health: Public health officials use it to assess if the distribution of a health condition, like diabetes, varies significantly across different populations or regions.
The Chi-Square Test is crucial for these fields as it provides a robust method for testing hypotheses about the relationships between categorical variables, thereby enabling informed decision-making based on statistical evidence.
Advantages and Limitations
The Chi-Square test is a powerful statistical tool used for analyzing categorical data. However, like all statistical methods, it has its own set of advantages and limitations.
Advantages
- Simple and Easy to Use: The Chi-Square test is straightforward to calculate and interpret, making it accessible even to those with limited statistical knowledge.
- Non-parametric Nature: It does not assume a normal distribution of the data, making it suitable for categorical data which often doesn't follow a normal distribution.
- Flexibility: The test can be used for a variety of purposes, including testing for independence between two categorical variables and checking the goodness of fit between observed and expected frequencies.
- Applicability: It is widely used in different fields such as social sciences, marketing, biology, and healthcare to analyze categorical data.
Limitations
- Sample Size Requirements: The Chi-Square test requires a sufficiently large sample size to be valid. Small sample sizes can lead to inaccurate results.
- Expected Frequency Assumption: Each expected frequency should be at least 5. If this condition is not met, the test may not be valid.
- Sensitivity to Data Distribution: The test is sensitive to how data is distributed across categories. Uneven distribution can affect the validity of the test.
- Interpretation Complexity: While calculating the test is simple, interpreting the results correctly can be challenging, especially when dealing with complex data sets or multiple comparisons.
In summary, the Chi-Square test is an essential tool for analyzing categorical data, offering ease of use and flexibility. However, researchers must be mindful of its limitations, particularly regarding sample size and expected frequency requirements, to ensure accurate and valid results.

Video hướng dẫn về kiểm tra Chi-Square và cách hiểu giả thuyết không trong kiểm tra Chi-Square.
Kiểm Tra Chi-Square
READ MORE:
Video hướng dẫn về thống kê Chi-Square và cách sử dụng nó trong kiểm tra giả thuyết, dành cho khóa học Thống kê AP trên Khan Academy.
Thống kê Chi-Square cho kiểm tra giả thuyết | Thống kê AP | Khan Academy