Topic chi square test formula example: Discover the essentials of the Chi-Square Test formula with detailed examples in this comprehensive guide. Learn how to calculate, interpret, and apply the Chi-Square Test for various types of data analysis. Enhance your understanding and application of this statistical tool with easy-to-follow steps and real-life examples.
Table of Content
- Chi-Square Test Formula and Example
- Introduction to Chi-Square Test
- Chi-Square Test Formula
- Types of Chi-Square Tests
- Step-by-Step Calculation of Chi-Square Test
- Examples of Chi-Square Tests
- Chi-Square Test Table
- Interpreting Chi-Square Test Results
- Common Applications of Chi-Square Tests
- Chi-Square Test Calculators and Tools
- Frequently Asked Questions (FAQs)
- YOUTUBE: Video hướng dẫn chi tiết về kiểm định Chi-Square, công thức và ví dụ minh họa. Tìm hiểu cách áp dụng kiểm định Chi-Square vào thực tế.
Chi-Square Test Formula and Example
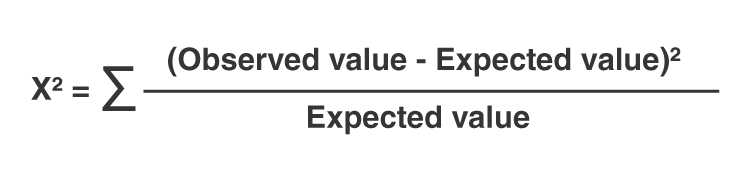
The chi-square test is a statistical test used to determine if there is a significant association between two categorical variables. It is commonly used in hypothesis testing. The chi-square formula is:
$$\chi^2 = \sum \frac{(O_i - E_i)^2}{E_i}$$
Where:
- \(O_i\) = observed frequency
- \(E_i\) = expected frequency
Steps to Perform a Chi-Square Test
- Define the hypotheses:
- Calculate the expected values:
- Compute the chi-square statistic:
- Determine the degrees of freedom (df):
- Compare the chi-square statistic to the critical value:
Null hypothesis (\(H_0\)): Assumes no association between the variables.
Alternative hypothesis (\(H_1\)): Assumes there is an association between the variables.
Expected value for each cell in the contingency table can be calculated using:
$$E_i = \frac{(\text{row total} \times \text{column total})}{\text{grand total}}$$
Sum up the \(\frac{(O_i - E_i)^2}{E_i}\) values for all cells in the table to get the chi-square statistic (\(\chi^2\)).
Degrees of freedom for a contingency table is calculated as:
$$df = (r - 1) \times (c - 1)$$
where \(r\) is the number of rows and \(c\) is the number of columns.
Using a chi-square distribution table, find the critical value for the given degrees of freedom and the chosen significance level (\(\alpha\), usually 0.05). If \(\chi^2\) is greater than the critical value, reject the null hypothesis.
Example
Consider the following contingency table of survey responses from 500 individuals on their political party preference by gender:
| Republican | Democrat | Independent | Total | |
| Male | 120 | 90 | 40 | 250 |
| Female | 110 | 95 | 45 | 250 |
| Total | 230 | 185 | 85 | 500 |
Expected values for each cell are calculated as:
$$E_i = \frac{(\text{row total} \times \text{column total})}{\text{grand total}}$$
For example, for Male Republicans:
$$E_i = \frac{(250 \times 230)}{500} = 115$$
Calculate \((O_i - E_i)^2 / E_i\) for each cell and sum them up to get the chi-square statistic:
$$\chi^2 = \sum \frac{(O_i - E_i)^2}{E_i} = 0.2174 + 0.0676 + 0.1471 + 0.2174 + 0.0676 + 0.1471 = 0.8642$$
Degrees of freedom (\(df\)) = (2-1)(3-1) = 2
Using a chi-square table, the critical value at \(\alpha = 0.05\) and \(df = 2\) is 5.991. Since 0.8642 < 5.991, we fail to reject the null hypothesis, indicating there is no significant association between gender and political party preference.
Conclusion
The chi-square test is a powerful tool for examining the relationships between categorical variables. By calculating the chi-square statistic and comparing it with the critical value, researchers can make informed decisions about their hypotheses.
READ MORE:
Introduction to Chi-Square Test
The Chi-Square Test is a statistical method used to determine if there is a significant association between categorical variables. This non-parametric test compares the observed frequencies in each category to the expected frequencies, which are calculated under the null hypothesis that there is no association between the variables.
There are two main types of Chi-Square Tests:
- Chi-Square Test of Independence: Used to determine if there is a significant relationship between two categorical variables.
- Chi-Square Goodness of Fit Test: Used to determine if a sample data matches an expected distribution.
The formula for the Chi-Square statistic is:
\[
\chi^2 = \sum \frac{(O_i - E_i)^2}{E_i}
\]
where \(O_i\) is the observed frequency and \(E_i\) is the expected frequency.
The Chi-Square Test involves the following steps:
- State the null and alternative hypotheses.
- Calculate the expected frequencies based on the null hypothesis.
- Compute the Chi-Square statistic using the observed and expected frequencies.
- Determine the degrees of freedom, which is calculated as (number of rows - 1) * (number of columns - 1) for the Test of Independence.
- Find the p-value corresponding to the Chi-Square statistic and degrees of freedom.
- Draw a conclusion to either reject or fail to reject the null hypothesis.
The Chi-Square Test is widely used in research and various fields such as genetics, marketing, and social sciences to analyze categorical data and draw meaningful conclusions.
Chi-Square Test Formula
The Chi-Square Test formula is used to determine the discrepancy between observed and expected frequencies in categorical data. It helps in testing the independence of two variables or the goodness of fit for a distribution.
The formula for the Chi-Square statistic is:
\[
\chi^2 = \sum \frac{(O_i - E_i)^2}{E_i}
\]
where:
- \( \chi^2 \) = Chi-Square statistic
- \( O_i \) = Observed frequency
- \( E_i \) = Expected frequency
To perform a Chi-Square Test, follow these steps:
- State the Hypotheses:
- Null Hypothesis (\(H_0\)): There is no significant difference between the observed and expected frequencies.
- Alternative Hypothesis (\(H_a\)): There is a significant difference between the observed and expected frequencies.
- Calculate Expected Frequencies:
The expected frequency for each category can be calculated as:
\[
E_i = \frac{( \text{Row Total} \times \text{Column Total} )}{\text{Grand Total}}
\] - Compute the Chi-Square Statistic:
Use the formula to calculate the Chi-Square value:
\[
\chi^2 = \sum \frac{(O_i - E_i)^2}{E_i}
\] - Determine the Degrees of Freedom:
The degrees of freedom (df) are calculated as:
\[
df = ( \text{number of rows} - 1 ) \times ( \text{number of columns} - 1 )
\] - Find the p-value:
Using the Chi-Square statistic and the degrees of freedom, find the p-value from the Chi-Square distribution table.
- Draw a Conclusion:
Compare the p-value with the significance level (α). If the p-value is less than α, reject the null hypothesis.
By following these steps, you can effectively use the Chi-Square Test to analyze categorical data and test hypotheses about the distribution of your data.
Types of Chi-Square Tests
The Chi-Square Test is a versatile statistical tool used to analyze categorical data. There are two primary types of Chi-Square Tests: the Chi-Square Test of Independence and the Chi-Square Goodness of Fit Test. Each serves a different purpose and is used in different scenarios.
Chi-Square Test of Independence
This test determines whether there is a significant association between two categorical variables. It assesses whether the distribution of sample categorical data matches an expected distribution under the assumption of independence.
- Set up the Hypotheses:
- Null Hypothesis (\(H_0\)): The variables are independent.
- Alternative Hypothesis (\(H_a\)): The variables are not independent.
- Construct a Contingency Table:
Create a table that displays the frequency distribution of the variables.
- Calculate Expected Frequencies:
Use the formula:
\[
E_{ij} = \frac{(\text{Row Total}_i \times \text{Column Total}_j)}{\text{Grand Total}}
\] - Compute the Chi-Square Statistic:
Apply the Chi-Square formula:
\[
\chi^2 = \sum \frac{(O_{ij} - E_{ij})^2}{E_{ij}}
\] - Determine Degrees of Freedom:
Calculate as:
\[
df = ( \text{number of rows} - 1 ) \times ( \text{number of columns} - 1 )
\] - Find the p-value and Draw a Conclusion:
Compare the p-value with the significance level to determine whether to reject the null hypothesis.
Chi-Square Goodness of Fit Test
This test determines if a sample data matches an expected distribution. It assesses how well the observed frequencies of a single categorical variable fit the expected frequencies based on a specified distribution.
- Set up the Hypotheses:
- Null Hypothesis (\(H_0\)): The observed frequencies match the expected frequencies.
- Alternative Hypothesis (\(H_a\)): The observed frequencies do not match the expected frequencies.
- Calculate Expected Frequencies:
Based on the theoretical distribution, calculate the expected frequency for each category.
- Compute the Chi-Square Statistic:
Use the formula:
\[
\chi^2 = \sum \frac{(O_i - E_i)^2}{E_i}
\] - Determine Degrees of Freedom:
Calculate as:
\[
df = \text{number of categories} - 1
\] - Find the p-value and Draw a Conclusion:
Compare the p-value with the significance level to determine whether to reject the null hypothesis.
Understanding these types of Chi-Square Tests and their applications allows researchers to effectively analyze categorical data and draw meaningful conclusions.
Step-by-Step Calculation of Chi-Square Test
The Chi-Square Test is used to determine whether there is a significant difference between the expected and observed frequencies in categorical data. Here is a detailed step-by-step guide to performing a Chi-Square Test:
- Define the Hypotheses:
- Null Hypothesis (\(H_0\)): Assumes no significant difference between the observed and expected frequencies.
- Alternative Hypothesis (\(H_a\)): Assumes a significant difference between the observed and expected frequencies.
- Collect the Data:
Gather the observed frequencies for each category in a contingency table.
Category Observed Frequency (\(O_i\)) Category 1 Observed Value 1 Category 2 Observed Value 2 - Calculate the Expected Frequencies:
For each category, calculate the expected frequency using:
\[
E_i = \frac{(\text{Row Total} \times \text{Column Total})}{\text{Grand Total}}
\] - Compute the Chi-Square Statistic:
Use the Chi-Square formula:
\[
\chi^2 = \sum \frac{(O_i - E_i)^2}{E_i}
\]Where \(O_i\) is the observed frequency and \(E_i\) is the expected frequency.
- Determine the Degrees of Freedom:
For a Chi-Square Test of Independence, calculate the degrees of freedom as:
\[
df = (\text{number of rows} - 1) \times (\text{number of columns} - 1)
\]For a Chi-Square Goodness of Fit Test, the degrees of freedom are:
\[
df = \text{number of categories} - 1
\] - Find the p-value:
Using the Chi-Square statistic and the degrees of freedom, find the p-value from the Chi-Square distribution table.
- Draw a Conclusion:
Compare the p-value to the significance level (usually 0.05). If the p-value is less than the significance level, reject the null hypothesis. This indicates that there is a significant difference between the observed and expected frequencies.
Following these steps allows you to effectively perform a Chi-Square Test, enabling you to analyze categorical data and make informed decisions based on your findings.
Examples of Chi-Square Tests
Chi-Square Tests are widely used in various fields to test hypotheses about categorical data. Below are detailed examples of how to perform Chi-Square Tests, including the Chi-Square Test of Independence and the Chi-Square Goodness of Fit Test.
Example 1: Chi-Square Test of Independence
This example examines whether there is an association between gender and preference for a new product.
- Define the Hypotheses:
- Null Hypothesis (\(H_0\)): Gender and product preference are independent.
- Alternative Hypothesis (\(H_a\)): Gender and product preference are not independent.
- Collect the Data:
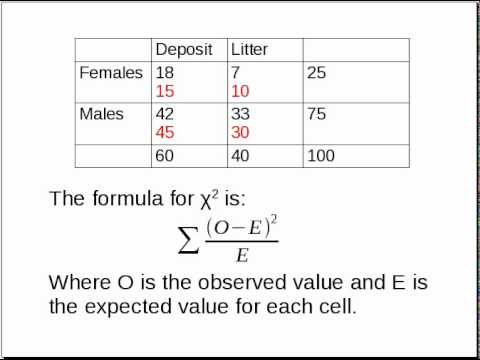
Observed frequencies in a contingency table:
Preference Male Female Total Like 30 20 50 Dislike 10 40 50 Total 40 60 100 - Calculate Expected Frequencies:
Expected frequency for each cell:
\[
E_{ij} = \frac{(\text{Row Total}_i \times \text{Column Total}_j)}{\text{Grand Total}}
\]For the cell (Like, Male):
\[
E_{11} = \frac{(50 \times 40)}{100} = 20
\] - Compute the Chi-Square Statistic:
Using the formula:
\[
\chi^2 = \sum \frac{(O_{ij} - E_{ij})^2}{E_{ij}}
\]For each cell, calculate the Chi-Square contribution and sum them up.
- Determine Degrees of Freedom:
\[
df = ( \text{number of rows} - 1 ) \times ( \text{number of columns} - 1 ) = (2 - 1) \times (2 - 1) = 1
\] - Find the p-value and Draw a Conclusion:
Compare the Chi-Square statistic to the critical value from the Chi-Square distribution table with 1 degree of freedom. If the p-value is less than 0.05, reject the null hypothesis.
Example 2: Chi-Square Goodness of Fit Test
This example tests whether a die is fair by comparing the observed frequency of each face to the expected frequency.
- Define the Hypotheses:
- Null Hypothesis (\(H_0\)): The die is fair.
- Alternative Hypothesis (\(H_a\)): The die is not fair.
- Collect the Data:
Observed frequencies:
Face Observed Frequency (\(O_i\)) 1 8 2 6 3 7 4 5 5 10 6 4 - Calculate Expected Frequencies:
For a fair die, the expected frequency for each face (with 40 rolls) is:
\[
E_i = \frac{40}{6} \approx 6.67
\] - Compute the Chi-Square Statistic:
Using the formula:
\[
\chi^2 = \sum \frac{(O_i - E_i)^2}{E_i}
\]Calculate the Chi-Square value for each face and sum them up.
- Determine Degrees of Freedom:
\[
df = \text{number of categories} - 1 = 6 - 1 = 5
\] - Find the p-value and Draw a Conclusion:
Compare the Chi-Square statistic to the critical value from the Chi-Square distribution table with 5 degrees of freedom. If the p-value is less than 0.05, reject the null hypothesis.
Example 3: Real-life Applications
Chi-Square Tests are used in various fields such as:
- Marketing: Analyzing consumer preferences and purchase behavior.
- Healthcare: Studying the association between patient characteristics and disease outcomes.
- Education: Investigating the relationship between teaching methods and student performance.
These examples illustrate the versatility and importance of Chi-Square Tests in analyzing categorical data and making data-driven decisions.
Chi-Square Test Table
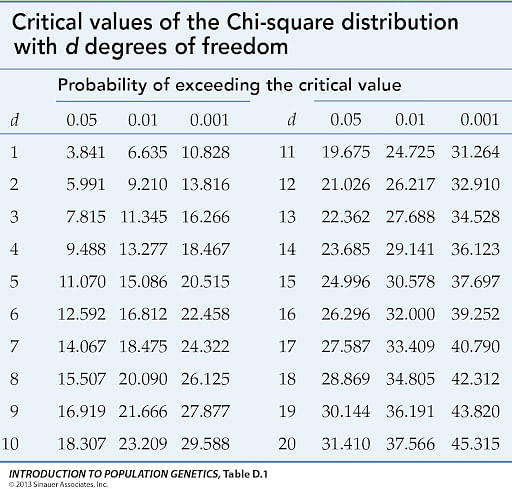
A Chi-Square Test Table, also known as the Chi-Square distribution table, is used to determine the critical value of the Chi-Square statistic for a given significance level and degrees of freedom. This table helps in deciding whether to reject the null hypothesis.
Below is a simplified Chi-Square Test Table for common significance levels (0.05 and 0.01) and degrees of freedom:
| Degrees of Freedom (df) | Critical Value (0.05) | Critical Value (0.01) |
|---|---|---|
| 1 | 3.841 | 6.635 |
| 2 | 5.991 | 9.210 |
| 3 | 7.815 | 11.345 |
| 4 | 9.488 | 13.277 |
| 5 | 11.070 | 15.086 |
| 6 | 12.592 | 16.812 |
| 7 | 14.067 | 18.475 |
| 8 | 15.507 | 20.090 |
| 9 | 16.919 | 21.666 |
| 10 | 18.307 | 23.209 |
To use this table:
- Determine the Degrees of Freedom:
Calculate the degrees of freedom (df) for your test. For a Chi-Square Test of Independence, use:
\[
df = (\text{number of rows} - 1) \times (\text{number of columns} - 1)
\]For a Chi-Square Goodness of Fit Test, use:
\[
df = \text{number of categories} - 1
\] - Select the Significance Level:
Common significance levels are 0.05 and 0.01. The choice depends on the confidence level required for the test.
- Find the Critical Value:
Locate the critical value in the table that corresponds to the calculated degrees of freedom and chosen significance level.
- Compare with the Chi-Square Statistic:
Compare the calculated Chi-Square statistic with the critical value. If the Chi-Square statistic is greater than the critical value, reject the null hypothesis.
Using the Chi-Square Test Table is essential for interpreting the results of your Chi-Square Test and making data-driven decisions based on statistical evidence.
Interpreting Chi-Square Test Results
Interpreting the results of a Chi-Square Test involves several steps to determine whether the observed data significantly deviates from the expected data. Here's a detailed guide to help you interpret the results:
- Calculate the Chi-Square Statistic:
Use the formula:
\[
\chi^2 = \sum \frac{(O_i - E_i)^2}{E_i}
\]where \(O_i\) is the observed frequency and \(E_i\) is the expected frequency.
- Determine Degrees of Freedom:
For a Chi-Square Test of Independence:
\[
df = (\text{number of rows} - 1) \times (\text{number of columns} - 1)
\]For a Chi-Square Goodness of Fit Test:
\[
df = \text{number of categories} - 1
\] - Select the Significance Level:
Common significance levels are 0.05 (5%) and 0.01 (1%). This choice determines the threshold for rejecting the null hypothesis.
- Find the Critical Value:
Using the Chi-Square distribution table, locate the critical value corresponding to the calculated degrees of freedom and chosen significance level.
- Compare the Chi-Square Statistic to the Critical Value:
Evaluate whether the Chi-Square statistic exceeds the critical value from the table.
- If \(\chi^2\) is greater than the critical value, reject the null hypothesis (\(H_0\)). This indicates that there is a significant difference between the observed and expected frequencies.
- If \(\chi^2\) is less than or equal to the critical value, do not reject the null hypothesis. This indicates that there is no significant difference between the observed and expected frequencies.
- Interpret the p-value:
The p-value represents the probability of obtaining a Chi-Square statistic as extreme as, or more extreme than, the one calculated from the sample data, assuming the null hypothesis is true.
- If the p-value is less than the chosen significance level (e.g., 0.05), reject the null hypothesis.
- If the p-value is greater than or equal to the chosen significance level, do not reject the null hypothesis.
- Draw a Conclusion:
Based on the comparison of the Chi-Square statistic to the critical value and the interpretation of the p-value, draw a conclusion about the hypothesis.
- Reject \(H_0\): Conclude that there is a significant difference between the observed and expected data.
- Fail to Reject \(H_0\): Conclude that there is no significant difference between the observed and expected data.
By following these steps, you can accurately interpret the results of a Chi-Square Test and understand the implications of your data analysis.
Common Applications of Chi-Square Tests
Chi-Square Tests are versatile statistical tools widely used in various fields to analyze categorical data and test hypotheses about population distributions. Here are some common applications:
- Market Research:
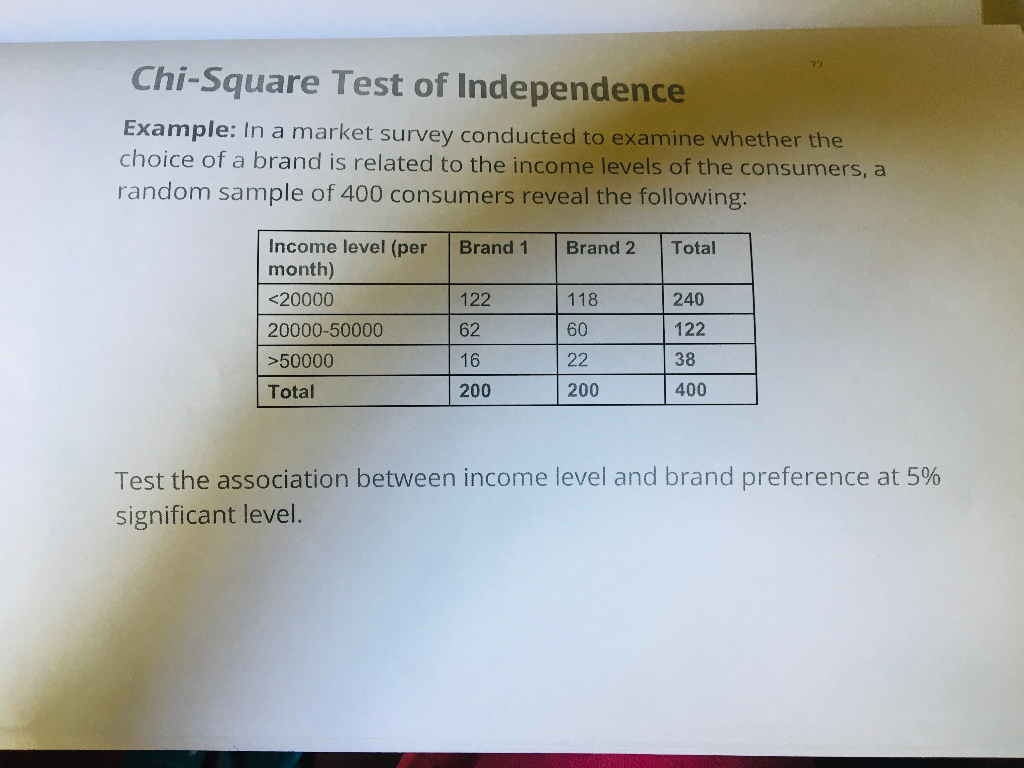
Chi-Square Tests are used to analyze consumer preferences, brand loyalty, and purchasing behavior. For example, a company might use a Chi-Square Test to determine if there is a significant difference in product preference across different demographic groups.
- Healthcare:
In healthcare, Chi-Square Tests help in studying the relationship between patient characteristics (e.g., age, gender) and health outcomes. For instance, researchers might use a Chi-Square Test to examine if there is an association between smoking status and the incidence of lung cancer.
- Genetics:
Geneticists use Chi-Square Tests to study inheritance patterns and the distribution of genetic traits. An example is testing whether the observed distribution of phenotypes in offspring matches the expected distribution according to Mendelian inheritance.
- Education:
Chi-Square Tests are employed to analyze the effectiveness of teaching methods, student performance, and educational interventions. For example, an educator might use a Chi-Square Test to determine if there is a significant association between teaching method and student success rates.
- Social Sciences:
In sociology and psychology, Chi-Square Tests help examine relationships between categorical variables such as social class, education level, and voting behavior. Researchers might use these tests to investigate if voting preferences are independent of socioeconomic status.
- Ecology:
Ecologists use Chi-Square Tests to study species distribution and habitat preferences. For example, a study might test whether the distribution of a particular species across different habitats deviates from what is expected by chance.
- Quality Control:
In manufacturing, Chi-Square Tests are used for quality control to ensure that products meet specified standards. For instance, a quality control manager might use a Chi-Square Test to determine if the defect rate in a batch of products is within acceptable limits.
These examples illustrate the broad applicability of Chi-Square Tests in analyzing categorical data and making data-driven decisions across various domains.
Chi-Square Test Calculators and Tools
Chi-Square Test calculators and tools simplify the process of conducting Chi-Square Tests by automating the calculations and providing user-friendly interfaces. Here are some popular calculators and tools you can use:
- Online Chi-Square Calculators:
There are many online calculators available that allow you to input your observed and expected frequencies and automatically calculate the Chi-Square statistic, degrees of freedom, and p-value. These tools often include step-by-step instructions and interpretation of results.
- GraphPad QuickCalcs: A simple and reliable online calculator for various statistical tests, including Chi-Square Tests.
- Social Science Statistics: This website offers an easy-to-use Chi-Square Test calculator with detailed explanations of the results.
- Statistical Software:
Many statistical software packages include functions for performing Chi-Square Tests. These tools are more powerful and offer advanced features for data analysis.
- IBM SPSS: A comprehensive statistical software that provides robust tools for conducting Chi-Square Tests and other statistical analyses.
- SAS: A powerful software suite used for advanced analytics, including Chi-Square Tests.
- R: An open-source programming language and software environment for statistical computing, which includes packages like
chisq.test()for conducting Chi-Square Tests. - Python (SciPy): The
scipy.statsmodule in Python offers functions for performing Chi-Square Tests.
- Spreadsheet Software:
Programs like Microsoft Excel and Google Sheets have built-in functions for performing Chi-Square Tests. These tools are accessible and widely used for basic data analysis.
- Microsoft Excel: Use the
CHISQ.TESTfunction to calculate the Chi-Square statistic and p-value. - Google Sheets: Similar to Excel, Google Sheets offers the
CHISQ.TESTfunction for Chi-Square calculations.
- Microsoft Excel: Use the
- Mobile Apps:
There are mobile applications available for both Android and iOS devices that provide Chi-Square Test calculations on the go.
- StatsGuru for SPSS: An app that helps users understand and perform various statistical tests, including Chi-Square Tests, using SPSS.
- Quick Chi-Square Test: A mobile app that provides a straightforward interface for calculating Chi-Square statistics.
These calculators and tools can significantly streamline the process of conducting Chi-Square Tests, making statistical analysis more accessible and efficient.
Frequently Asked Questions (FAQs)
-
What is a Chi-Square Test?
The Chi-Square test is a statistical method used to determine if there is a significant association between categorical variables. It compares the observed frequencies in each category to the frequencies expected if there was no association.
-
When should I use a Chi-Square Test?
The Chi-Square test is used when you have two categorical variables from a single population. It is commonly used in tests of independence and goodness of fit.
-
How do I calculate the Chi-Square statistic?
Use the formula:
\( \chi^2 = \sum \frac{(O_i - E_i)^2}{E_i} \)
where \(O_i\) is the observed frequency and \(E_i\) is the expected frequency. -
What are the steps to perform a Chi-Square Test?
- Define the hypotheses (null and alternative).
- Calculate the expected frequencies for each category.
- Compute the Chi-Square statistic using the formula.
- Determine the degrees of freedom.
- Find the p-value using the Chi-Square distribution table.
- Draw a conclusion based on the p-value and your significance level.
-
What is the formula for expected frequency?
The expected frequency for each category can be calculated using:
\( E = \frac{(\text{row total} \times \text{column total})}{\text{grand total}} \) -
What is the degrees of freedom in a Chi-Square Test?
The degrees of freedom for a Chi-Square test is calculated as:
\( (\text{number of rows} - 1) \times (\text{number of columns} - 1) \). -
What is a p-value in the context of a Chi-Square Test?
The p-value indicates the probability that the observed data would occur by chance if the null hypothesis is true. A low p-value (typically < 0.05) suggests that the observed data is unlikely under the null hypothesis, leading to its rejection.
-
What are the limitations of the Chi-Square Test?
The Chi-Square test requires a large sample size, and all expected frequencies should be at least 5. It is also sensitive to the sample size; with a very large sample, even small differences can become statistically significant.
-
Can Chi-Square Test be used for ordinal data?
While the Chi-Square test is primarily used for nominal data, it can be used for ordinal data, but it does not take into account the order of categories. For ordinal data, other tests like the Mann-Whitney U test may be more appropriate.
-
What is the difference between Chi-Square Test of Independence and Goodness of Fit?
The Chi-Square Test of Independence assesses whether two categorical variables are independent, while the Chi-Square Goodness of Fit test determines if a sample matches the distribution of a population.
Video hướng dẫn chi tiết về kiểm định Chi-Square, công thức và ví dụ minh họa. Tìm hiểu cách áp dụng kiểm định Chi-Square vào thực tế.
Kiểm Định Chi-Square
READ MORE:
Hướng dẫn chi tiết cách thực hiện kiểm định Chi-Square bằng tay. Tìm hiểu từng bước từ công thức đến ví dụ minh họa.
Cách Thực Hiện Kiểm Định Chi-Square (Bằng Tay)

:max_bytes(150000):strip_icc()/Chi-SquareStatistic_Final_4199464-7eebcd71a4bf4d9ca1a88d278845e674.jpg)