Topic chi squared hypothesis test: The Chi-Squared Hypothesis Test is a fundamental tool in statistics used to determine if there is a significant association between categorical variables or if a sample data matches an expected distribution. This guide explores the types of Chi-Squared tests, their assumptions, applications, and how to interpret the results effectively.
Table of Content
- Chi-Squared Hypothesis Test
- Introduction to Chi-Squared Hypothesis Test
- Definition and Purpose
- Chi-Squared Test for Independence
- Chi-Squared Goodness of Fit Test
- Calculating Chi-Squared Value
- Interpreting Chi-Squared Results
- Examples of Chi-Squared Tests
- Chi-Squared Test Assumptions
- Applications of Chi-Squared Test
- Limitations of Chi-Squared Test
- Conclusion
- YOUTUBE: Tìm hiểu về Kiểm Tra Chi-Squared với video này để hiểu rõ hơn về cách thực hiện và ứng dụng của phương pháp này trong thống kê.
Chi-Squared Hypothesis Test
The chi-squared test is a statistical method used to determine if there is a significant association between two categorical variables or if a single categorical variable follows a specified distribution. It is widely used in hypothesis testing.
Types of Chi-Squared Tests
- Chi-Square Goodness of Fit Test: This test determines if a sample data matches a population with a specific distribution. For example, it can test if a die is fair by comparing the observed frequencies of rolls to the expected frequencies.
- Chi-Square Test of Independence: This test assesses whether two categorical variables are independent. For instance, it can examine if there is a relationship between gender and voting preference in a sample of voters.
Steps in Performing a Chi-Squared Test
- Define Hypotheses: Formulate the null and alternative hypotheses. For the goodness of fit test, the null hypothesis (H0) states that the observed distribution fits the expected distribution. For the test of independence, H0 states that there is no association between the variables.
- Choose Significance Level: Select an alpha value (commonly 0.05) which defines the threshold for rejecting the null hypothesis.
- Calculate Expected Frequencies: Compute the expected frequencies for each category based on the null hypothesis.
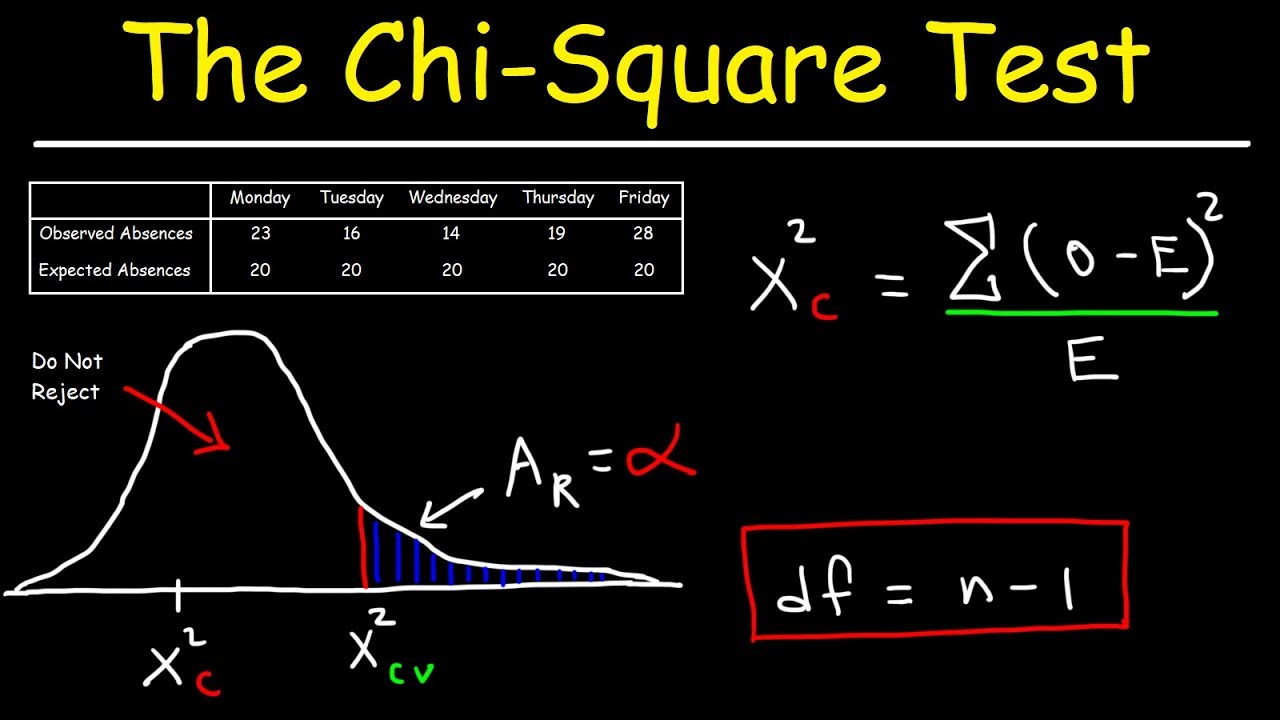
- Compute Test Statistic: Use the formula: \[ \chi^2 = \sum \frac{(O_i - E_i)^2}{E_i} \] where \( O_i \) is the observed frequency and \( E_i \) is the expected frequency.
- Compare to Critical Value: Compare the calculated chi-squared value to the critical value from the chi-squared distribution table with appropriate degrees of freedom.
- Draw Conclusion: If the chi-squared value is greater than the critical value, reject the null hypothesis. Otherwise, do not reject it.
Example: Chi-Square Goodness of Fit Test
Suppose a researcher wants to test if a die is fair. The null hypothesis is that the die is fair, meaning each of the six faces should appear with equal probability. The researcher rolls the die 60 times and observes the following frequencies: 8, 10, 9, 12, 11, 10.
The expected frequency for each face is \( \frac{60}{6} = 10 \). The chi-squared statistic is calculated as:
\[
\chi^2 = \sum \frac{(O_i - E_i)^2}{E_i} = \frac{(8-10)^2}{10} + \frac{(10-10)^2}{10} + \frac{(9-10)^2}{10} + \frac{(12-10)^2}{10} + \frac{(11-10)^2}{10} + \frac{(10-10)^2}{10} = 1.2
\]
With 5 degrees of freedom (6 categories - 1), the critical value at α = 0.05 is 11.07. Since 1.2 < 11.07, we do not reject the null hypothesis, indicating the die may be fair.
Example: Chi-Square Test of Independence
A researcher wants to determine if there is an association between gender (male, female) and voting preference (party A, party B). A sample of 200 individuals is surveyed, and the data is tabulated:
| Party A | Party B | Total | |
| Male | 43 | 57 | 100 |
| Female | 37 | 63 | 100 |
| Total | 80 | 120 | 200 |
The expected frequency for each cell is calculated as:
\[
E_{ij} = \frac{(\text{row total}) \times (\text{column total})}{\text{grand total}}
\]
For the cell Male-Party A, the expected frequency is:
\[
E_{11} = \frac{100 \times 80}{200} = 40
\]
The chi-squared statistic is computed as:
\[
\chi^2 = \sum \frac{(O_i - E_i)^2}{E_i} = \frac{(43-40)^2}{40} + \frac{(57-60)^2}{60} + \frac{(37-40)^2}{40} + \frac{(63-60)^2}{60} = 0.75
\]
With 1 degree of freedom (2-1 for rows, 2-1 for columns), the critical value at α = 0.05 is 3.84. Since 0.75 < 3.84, we do not reject the null hypothesis, indicating no significant association between gender and voting preference.
The chi-squared test is a versatile and widely used statistical tool for categorical data analysis, allowing researchers to test hypotheses about distributions and associations.
READ MORE:
Introduction to Chi-Squared Hypothesis Test
The Chi-Squared hypothesis test is a statistical method used to determine if there is a significant association between categorical variables. This test evaluates whether the observed frequencies in a contingency table differ from the expected frequencies, which are calculated under the assumption that the variables are independent.
The Chi-Squared test can be applied in various contexts, such as testing the goodness of fit, testing for independence, and testing for homogeneity. Each application follows a similar process but addresses different research questions.
To conduct a Chi-Squared test, follow these steps:
-
Define the hypotheses:
- Null hypothesis (\(H_0\)): The variables are independent (no association).
- Alternative hypothesis (\(H_A\)): The variables are not independent (there is an association).
-
Construct the contingency table:
Organize the data into a contingency table, showing the frequency distribution of the variables.
-
Calculate the expected frequencies:
Use the formula:
\[E_{ij} = \frac{(Row \, total) \times (Column \, total)}{Grand \, total}\] -
Compute the Chi-Squared statistic:
Apply the Chi-Squared formula:
\[X^2 = \sum \frac{(O_{ij} - E_{ij})^2}{E_{ij}}\]where \(O_{ij}\) represents the observed frequency and \(E_{ij}\) represents the expected frequency.
-
Determine the degrees of freedom:
Calculate the degrees of freedom (\(df\)) using the formula:
\[df = (r - 1) \times (c - 1)\]where \(r\) is the number of rows and \(c\) is the number of columns.
-
Compare the Chi-Squared statistic to the critical value:
Find the critical value from the Chi-Squared distribution table based on the degrees of freedom and significance level (\(\alpha\), typically 0.05).
-
Make a decision:
- If \(X^2\) is greater than the critical value, reject the null hypothesis (\(H_0\)).
- If \(X^2\) is less than the critical value, do not reject the null hypothesis (\(H_0\)).
The Chi-Squared test is a robust method for examining the relationship between categorical variables, providing insights into data patterns and associations.
Definition and Purpose
The Chi-squared hypothesis test is a statistical method used to determine if there is a significant association between categorical variables. It is a nonparametric test that assesses how the observed data fits the expected data under the null hypothesis. The test is particularly useful for categorical data and can be applied in various fields including biology, marketing, and social sciences.
The purpose of the Chi-squared test is to test hypotheses about the distribution of a categorical variable or the relationship between two categorical variables. There are two main types of Chi-squared tests:
- Chi-squared Goodness of Fit Test: This test determines if a sample matches the population. It compares the observed frequencies to the expected frequencies to see if there are significant deviations.
- Chi-squared Test of Independence: This test assesses whether two categorical variables are independent of each other. It examines the observed frequencies in a contingency table to see if the distribution of one variable differs depending on the other variable.
The Chi-squared statistic is calculated using the formula:
\[
\chi^2 = \sum \frac{(O - E)^2}{E}
\]
where \(O\) represents the observed frequency, \(E\) represents the expected frequency, and the summation is over all possible outcomes.
In summary, the Chi-squared test is a powerful tool for hypothesis testing in categorical data, allowing researchers to determine if there are significant differences between observed and expected frequencies.
Chi-Squared Test for Independence
The Chi-Squared Test for Independence is a statistical method used to determine whether there is a significant association between two categorical variables. This test helps to establish if the variables are independent or related in some way.
Here is a step-by-step process to conduct the Chi-Squared Test for Independence:
-
Define the Hypotheses:
- Null Hypothesis (\(H_0\)): The two variables are independent.
- Alternative Hypothesis (\(H_1\)): The two variables are not independent.
-
Create a Contingency Table:
Construct a table that displays the frequency distribution of the variables. For example:
Category 1 Category 2 Total Group 1 Observed (O11) Observed (O12) Row Total Group 2 Observed (O21) Observed (O22) Row Total Total Column Total Column Total Grand Total -
Calculate Expected Frequencies:
Using the formula \(E = \frac{{(\text{Row Total} \times \text{Column Total})}}{\text{Grand Total}}\), calculate the expected frequency for each cell in the table.
-
Compute the Chi-Squared Statistic:
Using the formula \(\chi^2 = \sum \frac{{(O - E)^2}}{E}\), where \(O\) is the observed frequency and \(E\) is the expected frequency, calculate the Chi-Squared statistic.
-
Determine the Degrees of Freedom:
The degrees of freedom for the test are calculated as \((\text{number of rows} - 1) \times (\text{number of columns} - 1)\).
-
Find the P-Value:
Using the Chi-Squared statistic and the degrees of freedom, determine the p-value from the Chi-Squared distribution table.
-
Make a Decision:
Compare the p-value to the significance level (e.g., 0.05). If the p-value is less than the significance level, reject the null hypothesis, indicating a significant association between the variables.
The Chi-Squared Test for Independence is widely used in research to examine relationships between categorical variables, such as studying the association between gender and political preference or between smoking status and incidence of lung disease.
Chi-Squared Goodness of Fit Test
The Chi-Squared Goodness of Fit Test is a statistical method used to determine if a sample data set fits a population with a specific distribution. It compares the observed frequencies in each category to the expected frequencies based on a hypothesized distribution.
This test is commonly used in various fields, including biology, marketing, and social sciences, to assess the goodness of fit of categorical data to an expected distribution. Below are the detailed steps and considerations for conducting a Chi-Squared Goodness of Fit Test.
Steps for Conducting the Chi-Squared Goodness of Fit Test
-
State the Hypotheses
- Null Hypothesis (\(H_0\)): The observed frequencies are consistent with the expected frequencies.
- Alternative Hypothesis (\(H_a\)): The observed frequencies are not consistent with the expected frequencies.
-
Calculate the Expected Frequencies
The expected frequency for each category is calculated using the formula:
\[
E_i = N \times P_i
\]where \(N\) is the total number of observations, and \(P_i\) is the expected proportion for category \(i\).
-
Compute the Chi-Squared Statistic
The Chi-Squared statistic (\(\chi^2\)) is computed using the formula:
\[
\chi^2 = \sum \frac{(O_i - E_i)^2}{E_i}
\]where \(O_i\) represents the observed frequency for category \(i\), and \(E_i\) is the expected frequency for category \(i\).
-
Determine the Degrees of Freedom
The degrees of freedom (\(df\)) for the test is calculated as:
\[
df = k - 1
\]where \(k\) is the number of categories.
-
Compare the Chi-Squared Statistic to the Critical Value
Using a Chi-Squared distribution table, compare the calculated \(\chi^2\) value to the critical value at the desired significance level (\(\alpha\)). If \(\chi^2\) is greater than the critical value, reject the null hypothesis.
Assumptions of the Chi-Squared Goodness of Fit Test
- The sample data is randomly selected.
- The variable under study is categorical.
- Expected frequency in each category should be at least 5.
Example Calculation
Suppose we have a sample of 100 individuals categorized into four groups with observed frequencies of 20, 30, 10, and 40. We want to test if these frequencies fit an expected distribution of 25%, 25%, 25%, and 25%.
| Category | Observed Frequency (\(O_i\)) | Expected Frequency (\(E_i\)) | (\(O_i - E_i\)) | (\(O_i - E_i\))^2 | \(\frac{(O_i - E_i)^2}{E_i}\) |
|---|---|---|---|---|---|
| 1 | 20 | 25 | -5 | 25 | 1 |
| 2 | 30 | 25 | 5 | 25 | 1 |
| 3 | 10 | 25 | -15 | 225 | 9 |
| 4 | 40 | 25 | 15 | 225 | 9 |
| Total \(\chi^2\) | 20 | ||||
The calculated \(\chi^2\) value is 20. With 3 degrees of freedom, we compare this to the critical value at the 0.05 significance level. If the critical value is 7.815, since 20 > 7.815, we reject the null hypothesis, indicating the observed frequencies do not fit the expected distribution.
Calculating Chi-Squared Value
The Chi-Squared (χ²) test is a statistical method used to compare observed data with data we would expect to obtain according to a specific hypothesis. The following steps outline the process for calculating the Chi-Squared value:
-
Define the Hypotheses:
- Null Hypothesis (H₀): Assumes no association between the variables.
- Alternative Hypothesis (H₁): Assumes some association between the variables.
-
Collect the Data:
Gather observed frequencies (O) from the sample data for each category.
-
Calculate the Expected Frequencies (E):
Use the formula for each cell in the contingency table:
\( E_{i} = \frac{(Row \, Total \times Column \, Total)}{Grand \, Total} \)
-
Compute the Chi-Squared Statistic:
Apply the formula:
\( \chi^{2} = \sum \frac{(O_{i} - E_{i})^2}{E_{i}} \)
-
Determine the Degrees of Freedom:
The degrees of freedom (df) are calculated as:
\( df = (Number \, of \, Rows - 1) \times (Number \, of \, Columns - 1) \)
-
Find the p-value:
Using the Chi-Squared statistic and the degrees of freedom, find the p-value from the Chi-Squared distribution table. The p-value helps to determine the statistical significance of the test.
-
Make a Decision:
Compare the p-value with the significance level (α). If \( p \leq α \), reject the null hypothesis. Otherwise, do not reject the null hypothesis.
The Chi-Squared test provides a way to test the independence of categorical variables and determine if the observed distribution of data fits an expected distribution.
Interpreting Chi-Squared Results
Interpreting the results of a chi-squared test involves comparing the calculated chi-squared statistic (\(\chi^2\)) to a critical value from the chi-squared distribution table. This process helps to determine whether the observed data significantly deviates from the expected data. Here is a step-by-step guide to interpreting the results:
-
Calculate the Chi-Squared Statistic:
After performing the chi-squared test, you will have a chi-squared statistic (\(\chi^2\)) which is calculated using the formula:
\[
\chi^2 = \sum \frac{(O_i - E_i)^2}{E_i}
\]
where \(O_i\) represents the observed frequency and \(E_i\) represents the expected frequency for each category. -
Determine the Degrees of Freedom (df):
The degrees of freedom for the chi-squared test depend on the type of test being performed:
- For Chi-Squared Test for Independence: \(df = (r - 1) \times (c - 1)\), where \(r\) is the number of rows and \(c\) is the number of columns.
- For Chi-Squared Goodness of Fit Test: \(df = n - 1\), where \(n\) is the number of categories.
-
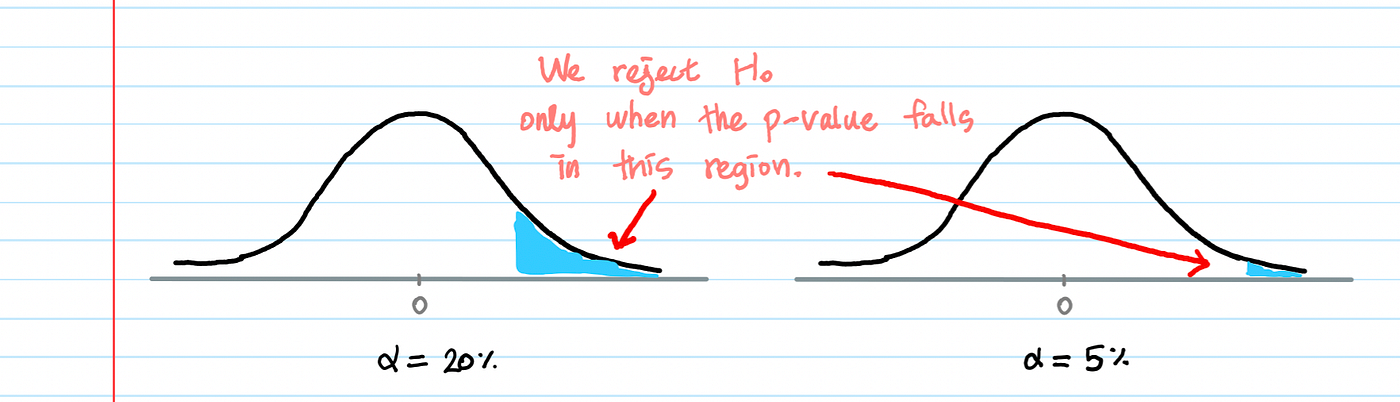
Select the Significance Level (\(\alpha\)):
Common significance levels are 0.05, 0.01, or 0.10. The significance level represents the probability of rejecting the null hypothesis when it is actually true (Type I error).
-
Find the Critical Value:
Using the degrees of freedom and the significance level, locate the critical value in the chi-squared distribution table. This value is the threshold against which the calculated chi-squared statistic will be compared.
Degrees of Freedom (df) Critical Value (\(\alpha = 0.05\)) Critical Value (\(\alpha = 0.01\)) 1 3.841 6.635 2 5.991 9.210 3 7.815 11.345 -
Compare the Chi-Squared Statistic to the Critical Value:
If the calculated chi-squared statistic (\(\chi^2\)) is greater than the critical value, you reject the null hypothesis. This indicates that there is a significant difference between the observed and expected frequencies.
If the calculated chi-squared statistic (\(\chi^2\)) is less than or equal to the critical value, you fail to reject the null hypothesis. This indicates that there is no significant difference between the observed and expected frequencies.
By following these steps, you can effectively interpret the results of a chi-squared test and determine whether your observed data significantly deviates from what was expected.
Examples of Chi-Squared Tests
The Chi-Squared test can be applied in various scenarios to test for independence or goodness of fit. Here are some detailed examples of how this test can be used:
1. Testing the Fairness of a Die
In this example, we want to test if a die is fair. We roll the die 50 times and record the number of times each face appears. We then compare the observed frequencies to the expected frequencies (which should be equal for a fair die).
| Face | Observed | Expected |
|---|---|---|
| 1 | 8 | 8.33 |
| 2 | 9 | 8.33 |
| 3 | 7 | 8.33 |
| 4 | 10 | 8.33 |
| 5 | 8 | 8.33 |
| 6 | 8 | 8.33 |
Using the Chi-Squared formula, we calculate the test statistic and compare it to the critical value from the Chi-Squared distribution table to determine if the die is fair.
2. Distribution of M&M's Colors
Suppose we want to know if the distribution of M&M's colors in a bag matches the expected distribution: 20% yellow, 30% blue, 30% red, and 20% other colors. We open a bag and count the number of each color.
| Color | Observed | Expected |
|---|---|---|
| Yellow | 18 | 20 |
| Blue | 32 | 30 |
| Red | 28 | 30 |
| Other | 22 | 20 |
We use the Chi-Squared Goodness of Fit Test to compare the observed and expected frequencies and determine if the color distribution matches the expected proportions.
3. Voting Preference & Gender
Researchers want to know if there is an association between gender and voting preference in a town. They survey 500 voters and record their gender and political party preference.
| Republican | Democrat | Independent | Total | |
|---|---|---|---|---|
| Male | 120 | 90 | 40 | 250 |
| Female | 110 | 95 | 45 | 250 |
| Total | 230 | 185 | 85 | 500 |
They perform a Chi-Squared Test of Independence to see if there is a statistically significant association between gender and voting preference.
4. Favorite Color & Favorite Sport
In this example, researchers survey 100 people to find out if there is an association between their favorite color and their favorite sport.
They collect data and organize it into a contingency table, then perform a Chi-Squared Test of Independence to analyze the relationship between these two categorical variables.
By calculating the Chi-Squared statistic and comparing it to the critical value, they determine if the association is significant.
These examples illustrate how versatile the Chi-Squared test is for analyzing categorical data in various fields, from psychology and social sciences to business and marketing.
Chi-Squared Test Assumptions
The Chi-Squared test, a powerful statistical tool for hypothesis testing, operates under several key assumptions to ensure the validity and reliability of its results. These assumptions are critical to properly interpret the results of the test.
-
Both Variables are Categorical:
The Chi-Squared test is designed for categorical data. This means that the variables being analyzed must be discrete and consist of distinct categories or groups. Examples include marital status (e.g., married, single, divorced) and political preference (e.g., republican, democrat, independent).
-
Independence of Observations:
Each observation should be independent of all others. This implies that the outcome of one observation should not influence or affect the outcome of another. Ensuring independence often involves using random sampling methods to collect data.
-
Mutually Exclusive Categories:
Categories in the contingency table should be mutually exclusive, meaning that each observation should only fit into one category or cell. This ensures that no individual or observation is counted in more than one category.
-
Expected Frequency:
The expected frequency in each cell of the contingency table should be at least 5 in at least 80% of the cells, and no cell should have an expected frequency less than 1. This helps to ensure the validity of the Chi-Squared approximation to the true distribution.
If these assumptions are violated, the results of the Chi-Squared test may not be reliable. In such cases, alternative methods such as Fisher's Exact Test may be more appropriate.
By adhering to these assumptions, researchers can confidently use the Chi-Squared test to draw meaningful conclusions from their categorical data.

Applications of Chi-Squared Test
The Chi-Squared test is widely used in various fields to analyze categorical data and test hypotheses about the relationships between different variables. Here are some key applications:
1. Biology and Genetics
- Genetic Linkage Analysis: Chi-squared tests help determine if certain traits are linked to specific genes by comparing observed genetic distributions to expected ratios based on Mendelian inheritance.
- Population Studies: Used to analyze the distribution of genotypes and phenotypes in different populations to test hypotheses about evolutionary processes and genetic drift.
2. Psychology and Social Sciences
- Behavioral Studies: Researchers use Chi-squared tests to examine the association between different behavioral variables, such as the relationship between smoking habits and stress levels.
- Survey Analysis: Helps analyze categorical survey data to determine if responses differ significantly among various demographic groups, such as age, gender, or education level.
3. Business and Marketing
- Market Research: Used to analyze consumer preferences and behavior by comparing observed purchase patterns with expected distributions, helping businesses tailor their marketing strategies.
- Quality Control: Helps in testing whether the proportion of defective items in a batch differs from what is expected, ensuring product quality standards are met.
Overall, the Chi-Squared test is a versatile tool for analyzing categorical data across a wide range of fields, providing valuable insights into relationships and patterns within the data.
Limitations of Chi-Squared Test
The chi-squared test, while widely used in statistics, has several important limitations that must be considered when interpreting results:
- Categorical Data Only: The chi-squared test is suitable only for categorical data. It cannot be used to analyze continuous or interval data, limiting its applicability in cases where numerical data is involved.
- Assumption of Independence: The test assumes that the variables are independent. If the variables are not truly independent, the results of the chi-squared test may be misleading. This assumption is critical and violations can lead to incorrect conclusions.
- Sample Size Requirements: The chi-squared test requires a sufficiently large sample size to be valid. Small sample sizes can result in inaccurate chi-squared statistics and potentially misleading p-values. It's generally recommended that each expected frequency be at least 5.
- Sensitivity to Sample Size: With very large sample sizes, even small, practically insignificant differences can become statistically significant. This can lead to overestimating the importance of trivial differences.
- Expected Cell Frequencies: The expected frequency in each cell of a contingency table should not be too small. If the expected frequency is less than 5, the chi-squared test may not be appropriate, and alternative methods like Fisher's exact test may be more suitable.
- No Information on Strength of Association: The chi-squared test can indicate whether an association exists between variables, but it does not provide information about the strength or direction of the association.
- Post-Hoc Testing: After finding a significant chi-squared statistic, it is often necessary to perform post-hoc tests to determine which specific categories are responsible for the significance. This can complicate the analysis and interpretation.
Despite these limitations, the chi-squared test remains a valuable tool for analyzing categorical data, particularly in the fields of genetics, marketing, and social sciences. It is essential, however, to be aware of its constraints and apply it appropriately to ensure valid and reliable results.
Conclusion
The Chi-Squared hypothesis test is a robust statistical tool used to determine whether there is a significant association between categorical variables. It serves as a fundamental technique in various fields such as biology, social sciences, business, and marketing, helping researchers validate their hypotheses with quantitative rigor.
The test operates by comparing the observed frequencies of events in each category to the frequencies expected under the null hypothesis, thereby allowing us to identify deviations that are statistically significant. It encompasses two main types: the Chi-Squared Test for Independence and the Chi-Squared Goodness of Fit Test, each tailored to different types of data and research questions.
Despite its broad applicability, the Chi-Squared test has its limitations, including sensitivity to sample size and the assumption of expected frequency counts. Researchers must carefully consider these factors to ensure the validity of their conclusions. By understanding these constraints and the proper application of the test, one can make meaningful inferences about their data.
In conclusion, the Chi-Squared hypothesis test is an essential method for analyzing categorical data, offering valuable insights and supporting informed decision-making. Its versatility and ease of use make it a staple in statistical analysis, highlighting the importance of statistical literacy in research.
Tìm hiểu về Kiểm Tra Chi-Squared với video này để hiểu rõ hơn về cách thực hiện và ứng dụng của phương pháp này trong thống kê.
Kiểm Tra Chi-Squared
READ MORE:
Khám phá cách sử dụng thống kê Chi-Squared cho kiểm định giả thuyết trong video này từ Khan Academy. Học cách áp dụng phương pháp này trong AP Thống Kê.
Thống kê Chi-Squared cho kiểm định giả thuyết | AP Thống Kê | Khan Academy
:max_bytes(150000):strip_icc()/Chi-SquareStatistic_Final_4199464-7eebcd71a4bf4d9ca1a88d278845e674.jpg)