Topic chi square test null hypothesis example: The chi-square test is a powerful statistical tool used to determine if there is a significant association between categorical variables. This article explores the null hypothesis for a chi-square test with a practical example, explaining the steps involved from hypothesis formulation to conclusion. Whether you're new to statistics or brushing up on your skills, this guide will enhance your understanding of the chi-square test.
Table of Content
- Chi-Square Test: Null Hypothesis Example
- Introduction to Chi-Square Test of Independence
- Understanding the Null Hypothesis
- Setting Up the Hypotheses
- Conditions for Using the Chi-Square Test
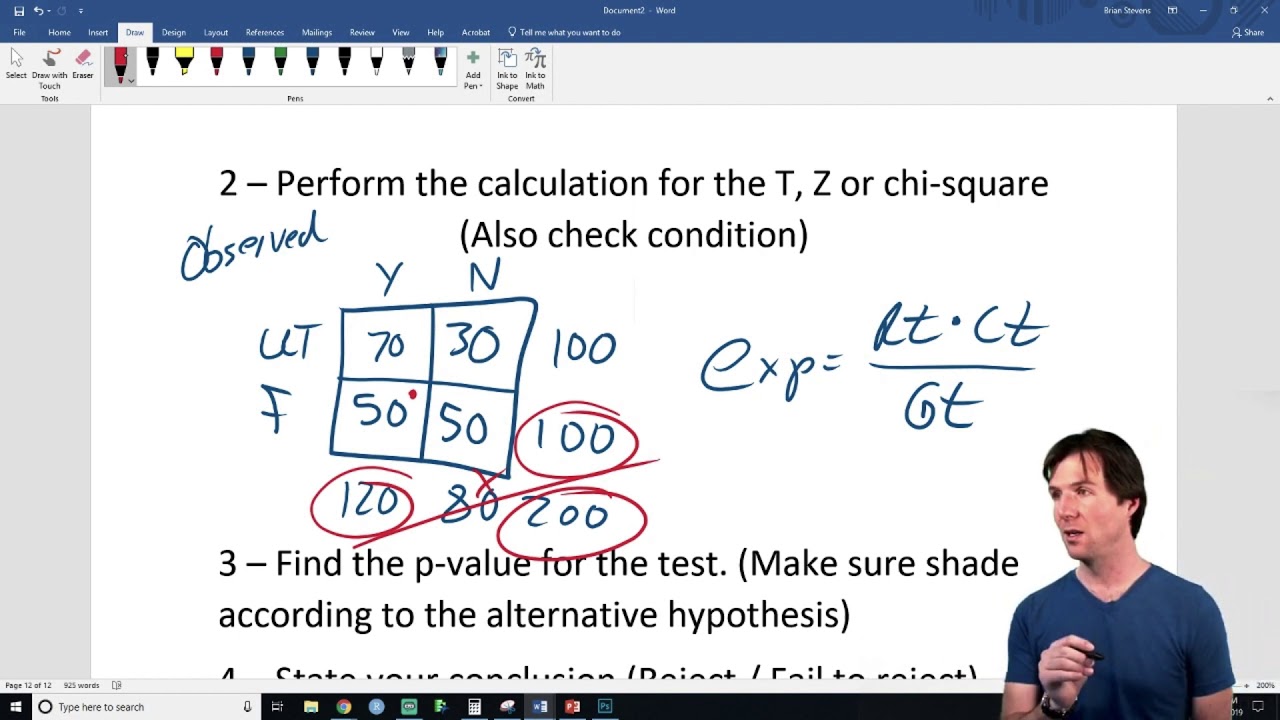
- Calculating Expected Values
- Performing the Chi-Square Test
- Interpreting the Results
- Example Scenarios and Applications
- Software Tools for Chi-Square Test
- Common Mistakes and Pitfalls
- Additional Resources and Tutorials
- YOUTUBE: Video hướng dẫn chi tiết về kiểm định Chi-Square, bao gồm cả ví dụ về giả thuyết không. Phù hợp cho người học thống kê và nghiên cứu.
Chi-Square Test: Null Hypothesis Example
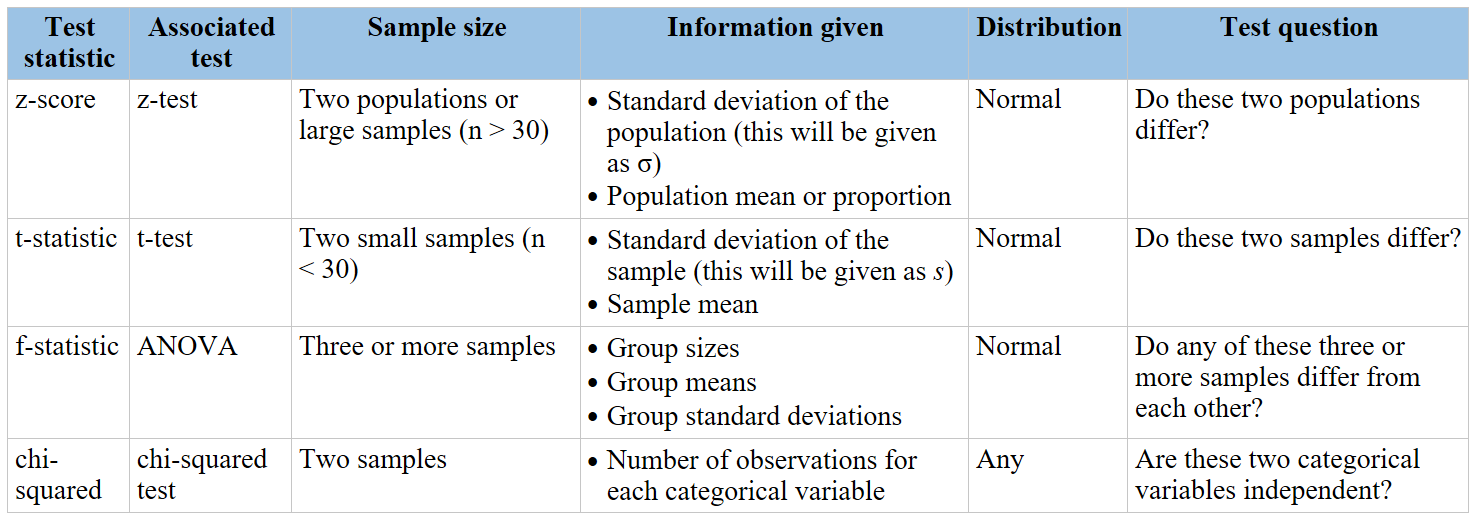
The chi-square test is a statistical method used to determine if there is a significant association between two categorical variables. The most common types of chi-square tests are the chi-square goodness of fit test and the chi-square test of independence.
Chi-Square Test of Independence
This test checks whether two categorical variables are related or independent. For example, a city wants to test whether an educational flyer or a phone call is more effective at encouraging recycling. They randomly select 300 households and assign them to receive either the flyer, a phone call, or no intervention (control group). After six months, they collect data on whether each household recycles or not.
Null and Alternative Hypotheses
- Null Hypothesis (H0): There is no association between the type of intervention and the recycling behavior of households.
- Alternative Hypothesis (Ha): There is an association between the type of intervention and the recycling behavior of households.
Contingency Table
| Intervention | Recycles | Does not recycle | Row Totals |
|---|---|---|---|
| Flyer | 89 | 9 | 98 |
| Phone call | 84 | 8 | 92 |
| Control | 86 | 24 | 110 |
| Column Totals | 259 | 41 | 300 |
Chi-Square Test Formula
The chi-square test statistic is calculated using the formula:
\[\chi^2 = \sum \frac{(O_i - E_i)^2}{E_i}\]
Where \(O_i\) is the observed frequency and \(E_i\) is the expected frequency.
Calculation Steps
- Define the null and alternative hypotheses.
- Calculate the expected frequencies for each cell in the contingency table.
- Use the chi-square formula to compute the test statistic.
- Compare the test statistic to the critical value from the chi-square distribution table with the appropriate degrees of freedom.
- Draw a conclusion: If the test statistic is greater than the critical value, reject the null hypothesis.
Example Calculation
Assume we have calculated the expected frequencies and the chi-square test statistic is 5.36 with 2 degrees of freedom. Using a chi-square distribution table, we find the critical value for \(\alpha = 0.05\) is 5.99.
Since 5.36 < 5.99, we fail to reject the null hypothesis and conclude that there is no significant association between the type of intervention and recycling behavior.
READ MORE:
Introduction to Chi-Square Test of Independence
The Chi-Square Test of Independence is a statistical method used to determine if there is a significant association between two categorical variables. This nonparametric test evaluates whether the observed frequencies in a contingency table differ from the expected frequencies if the variables were independent.
The test is particularly useful in examining relationships within a sample, where both variables are categorical. For example, it can be used to determine if there is an association between gender and voting preference, or if an educational intervention impacts recycling habits across different households.
To perform the Chi-Square Test of Independence, follow these steps:
- Formulate the null hypothesis (H0): This hypothesis states that there is no association between the variables. Any observed difference is due to random chance.
- Formulate the alternative hypothesis (HA): This hypothesis states that there is an association between the variables.
- Create a contingency table: Organize the data into a table that displays the frequency of occurrences for each combination of categories.
- Calculate the expected frequencies: Using the marginal totals of the contingency table, compute the expected frequency for each cell under the assumption that the variables are independent.
- Compute the chi-square statistic: This involves summing the squared difference between observed and expected frequencies, divided by the expected frequency for each cell.
The formula for the chi-square statistic (\(\chi^2\)) is:
\[
\chi^2 = \sum \frac{(O_i - E_i)^2}{E_i}
\]
where \(O_i\) represents the observed frequency and \(E_i\) represents the expected frequency for cell \(i\).
The chi-square statistic is then compared to a critical value from the chi-square distribution table, with degrees of freedom calculated as:
\[
df = (r-1) \times (c-1)
\]
where \(r\) is the number of rows and \(c\) is the number of columns in the contingency table.
If the chi-square statistic exceeds the critical value, the null hypothesis is rejected, indicating a significant association between the variables.
In summary, the Chi-Square Test of Independence is a powerful tool for identifying relationships between categorical variables, making it an essential technique in various fields, including social sciences, marketing, and medical research.
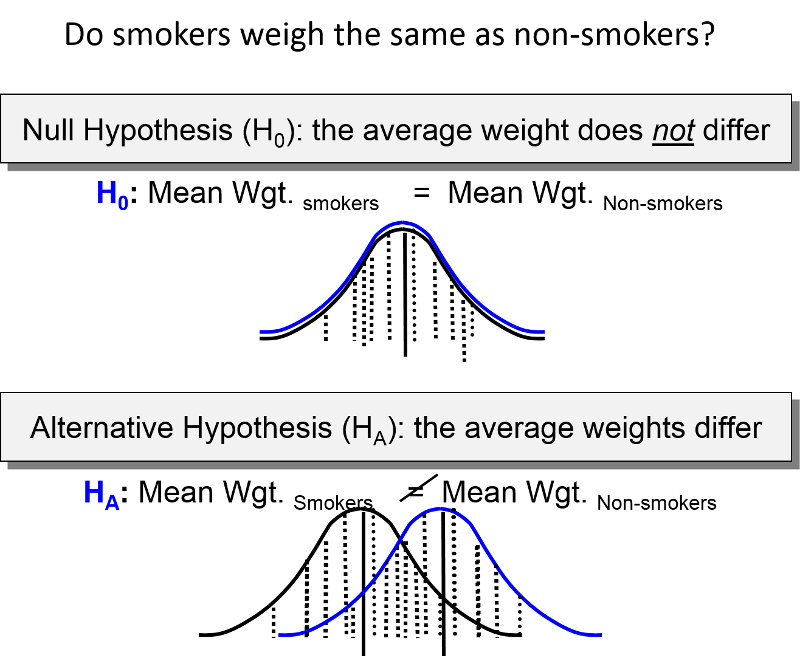
Understanding the Null Hypothesis
The null hypothesis (\(H_0\)) is a fundamental concept in statistical hypothesis testing. It represents a default position that there is no effect or no relationship between variables. When conducting a chi-square test, the null hypothesis typically states that any observed differences between the data and the expected distribution are due to random chance.
In a chi-square test of independence, the null hypothesis asserts that two categorical variables are independent. This means that the distribution of one variable is not affected by the other variable. The alternative hypothesis (\(H_a\)) is that the variables are dependent.
To illustrate, let's consider an example. Suppose we want to test whether gender is independent of education level. We survey a random sample of individuals and categorize them by gender and their highest education level. The null hypothesis for this test would be:
\[ H_0: \text{Gender and education level are independent} \]
\[ H_a: \text{Gender and education level are dependent} \]
We summarize the data in a contingency table and calculate the expected frequencies assuming the null hypothesis is true. The chi-square test statistic is computed as:
\[ \chi^2 = \sum \frac{(O - E)^2}{E} \]
where \(O\) represents the observed frequency, and \(E\) is the expected frequency under the null hypothesis.
For example, if the observed and expected frequencies for education levels across genders are:
| Gender | High School | Bachelors | Masters | Ph.D. | Total |
| Female (Observed) | 60 | 54 | 46 | 41 | 201 |
| Male (Observed) | 40 | 44 | 53 | 57 | 194 |
| Female (Expected) | 50.89 | 49.87 | 50.38 | 49.87 | 201 |
| Male (Expected) | 49.11 | 48.13 | 48.62 | 48.13 | 194 |
Using these values, we calculate the chi-square statistic:
\[ \chi^2 = \frac{(60 - 50.89)^2}{50.89} + \frac{(54 - 49.87)^2}{49.87} + \cdots + \frac{(57 - 48.13)^2}{48.13} = 8.006 \]
We then compare the calculated chi-square statistic to a critical value from the chi-square distribution table with the appropriate degrees of freedom (in this case, \( (2-1)(4-1) = 3 \) degrees of freedom). If our calculated value exceeds the critical value, we reject the null hypothesis, concluding that gender and education level are dependent.
In this example, if the critical value at a 5% significance level is 7.815, since 8.006 > 7.815, we reject the null hypothesis and conclude that there is a significant relationship between gender and education level.
Setting Up the Hypotheses
When performing a chi-square test of independence, the first step is to set up the null and alternative hypotheses. These hypotheses are essential as they establish the framework for your statistical test.
The null hypothesis (\(H_0\)) assumes that there is no association between the two categorical variables being studied. In contrast, the alternative hypothesis (\(H_a\)) posits that there is a significant association between these variables.
Here are the steps to set up the hypotheses for a chi-square test:
- Define the two categorical variables you are studying. For example, let's consider a study examining the relationship between gender (male, female) and preference for a type of movie genre (action, drama, comedy).
- State the null hypothesis (\(H_0\)). In this example, \(H_0\) would be: "There is no relationship between gender and movie genre preference."
- State the alternative hypothesis (\(H_a\)). For this example, \(H_a\) would be: "There is a relationship between gender and movie genre preference."
Once the hypotheses are established, data is collected and organized into a contingency table. The chi-square test statistic is then calculated to determine whether to reject the null hypothesis in favor of the alternative hypothesis.
Conditions for Using the Chi-Square Test
The Chi-Square test is a statistical method used to determine if there is a significant association between categorical variables. To use this test effectively, certain conditions must be met:
- Independence of Observations: The data should be collected through random sampling and each observation should be independent of others.
- Expected Frequency: The expected frequency for each category should be at least 5. If this condition is not met, combining categories or using Fisher's exact test might be necessary.
- Sample Size: A sufficiently large sample size is essential to ensure the validity of the test results. Generally, larger samples provide more reliable results.
- Categorical Data: The variables should be categorical (nominal or ordinal) and not continuous. If the data is continuous, it must be converted into categorical data by binning.
When these conditions are satisfied, the Chi-Square test can be a powerful tool to analyze the relationship between variables. For example, it is commonly used in surveys and experiments where researchers seek to understand associations between demographic factors and responses or behaviors.
The steps to perform a Chi-Square test generally include:
- Formulate Hypotheses: Define the null hypothesis (H0) stating that there is no association between the variables, and the alternative hypothesis (H1) indicating that an association exists.
- Construct a Contingency Table: Create a table summarizing the frequencies of the observed categories.
- Calculate Expected Frequencies: Compute the expected frequencies based on the assumption that the null hypothesis is true.
- Compute the Chi-Square Statistic: Use the formula: \[ \chi^2 = \sum \frac{(O_i - E_i)^2}{E_i} \] where \( O_i \) is the observed frequency and \( E_i \) is the expected frequency.
- Determine the p-value: Compare the Chi-Square statistic to the critical value from the Chi-Square distribution table to find the p-value.
- Draw Conclusions: Based on the p-value, determine whether to reject or fail to reject the null hypothesis. A p-value less than the significance level (commonly 0.05) indicates that the null hypothesis can be rejected.
By following these steps and ensuring that the necessary conditions are met, researchers can confidently use the Chi-Square test to explore relationships between categorical variables in their data.

Calculating Expected Values
The calculation of expected values is a crucial step in the Chi-Square Test of Independence. The expected value for each cell in a contingency table is computed under the assumption that the null hypothesis is true, which posits that the variables are independent. The formula to calculate the expected value \(E\) is given by:
\[ E = \frac{\text{row total} \times \text{column total}}{\text{sample size}} \]
Here’s a step-by-step guide to calculating the expected values:
- Construct a contingency table with the observed frequencies.
- Compute the row totals and column totals for the table.
- Calculate the expected value for each cell using the formula above.
For a concrete example, consider a study examining the relationship between gender (male, female) and education level (high school, bachelor’s, master’s, Ph.D.) with the following observed frequencies:
| High School | Bachelor’s | Master’s | Ph.D. | Total | |
| Female | 60 | 54 | 46 | 41 | 201 |
| Male | 40 | 44 | 53 | 57 | 194 |
| Total | 100 | 98 | 99 | 98 | 395 |
To calculate the expected value for females with a high school education:
\[ E_{\text{female, high school}} = \frac{\text{row total (female)} \times \text{column total (high school)}}{\text{sample size}} = \frac{201 \times 100}{395} \approx 50.886 \]
Repeat this calculation for each cell in the contingency table. For example, the expected value for males with a Ph.D. is:
\[ E_{\text{male, Ph.D.}} = \frac{\text{row total (male)} \times \text{column total (Ph.D.)}}{\text{sample size}} = \frac{194 \times 98}{395} \approx 48.132 \]
By following these steps, you can calculate the expected values for all cells in the contingency table, which are essential for conducting the Chi-Square Test of Independence.
Performing the Chi-Square Test
The Chi-Square test is a statistical method used to determine if there is a significant association between two categorical variables. Here is a step-by-step guide to performing the Chi-Square test:
-
Define the Hypotheses:
- Null Hypothesis (H0): Assumes that there is no association between the variables, i.e., they are independent.
- Alternative Hypothesis (H1): Assumes that there is an association between the variables, i.e., they are not independent.
-
Collect Data:
Gather data and organize it into a contingency table. This table will show the frequency distribution of the variables.
-
Calculate Expected Frequencies:
Use the formula to calculate the expected frequencies for each cell in the table:
Expected value = (Row total * Column total) / Grand total
For example, if you have the following observed frequencies:
Category 1 Category 2 Total Group 1 O11 O12 Row Total Group 2 O21 O22 Row Total Total Column Total Column Total Grand Total The expected frequency for cell (1,1) would be:
E11 = (Row Total1 * Column Total1) / Grand Total
-
Compute the Chi-Square Statistic:
Calculate the Chi-Square statistic using the formula:
X2 = Σ[(O - E)2 / E]
Where O represents the observed frequency and E represents the expected frequency. Sum this calculation for all cells in the table.
-
Determine the Degrees of Freedom:
Degrees of freedom (df) are calculated as:
df = (Number of rows - 1) * (Number of columns - 1)
-
Find the P-value:
Using the Chi-Square statistic and the degrees of freedom, find the p-value from the Chi-Square distribution table.
-
Make a Decision:
Compare the p-value to your significance level (usually 0.05). If the p-value is less than the significance level, reject the null hypothesis. This suggests that there is a significant association between the variables.
By following these steps, you can effectively perform a Chi-Square test to determine the association between categorical variables.
Interpreting the Results
After performing the Chi-Square Test of Independence, the next crucial step is to interpret the results to determine whether there is a significant association between the variables. Here is a detailed, step-by-step guide:
-
Calculate the Chi-Square Statistic (X2):
The Chi-Square statistic is calculated using the formula:
\[
X^2 = \sum \frac{(O_i - E_i)^2}{E_i}
\]
where \(O_i\) is the observed frequency and \(E_i\) is the expected frequency. -
Determine the Degrees of Freedom (df):
The degrees of freedom for the test are calculated using the formula:
\[
df = (r - 1) \times (c - 1)
\]
where \(r\) is the number of rows and \(c\) is the number of columns in the contingency table. -
Find the P-value:
Using the Chi-Square statistic and the degrees of freedom, find the p-value from the Chi-Square distribution table or using statistical software. The p-value indicates the probability of observing the data if the null hypothesis is true.
-
Compare the P-value to the Significance Level (α):
Typically, the significance level (α) is set at 0.05. If the p-value is less than α, you reject the null hypothesis.
-
Draw a Conclusion:
- If the P-value ≤ α: Reject the null hypothesis. There is sufficient evidence to suggest that there is an association between the variables.
- If the P-value > α: Fail to reject the null hypothesis. There is not enough evidence to suggest an association between the variables.
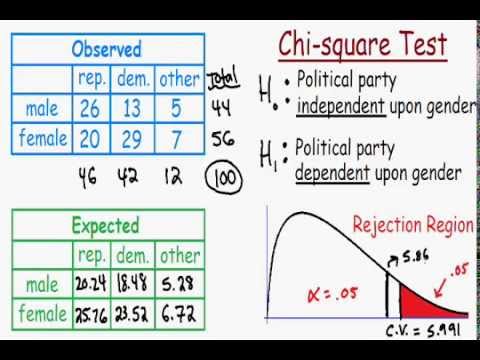
For example, suppose we are testing the association between gender and political party preference. After calculating the Chi-Square statistic and the p-value, we find that the p-value is 0.03. Since 0.03 < 0.05, we reject the null hypothesis and conclude that there is a significant association between gender and political party preference.
It is important to interpret the results in the context of the study and consider other factors that may influence the association. Additionally, ensure that the expected frequencies are sufficiently large (usually all should be at least 5) to validate the use of the Chi-Square test.
Example Scenarios and Applications
The Chi-Square Test of Independence is widely used in various fields to determine whether there is a significant association between two categorical variables. Here are some example scenarios and applications of the Chi-Square Test of Independence:
1. Recycling Intervention Effectiveness
Imagine a city wants to determine whether different interventions affect household recycling rates. They test two methods: an educational flyer and a phone call, against a control group with no intervention. After six months, they collect data on whether households recycle.
| Intervention | Recycles | Does not Recycle | Row Totals |
|---|---|---|---|
| Flyer | 89 | 9 | 98 |
| Phone Call | 84 | 8 | 92 |
| Control | 86 | 24 | 110 |
| Column Totals | 259 | 41 | 300 |
The city uses the Chi-Square Test of Independence to determine if the proportion of households that recycle differs significantly between the three groups.
2. Online Course Participation
A study at a university aims to find out if there is a relationship between students' gender and their participation in online courses. The data is collected in the following contingency table:
| Gender | Yes | No | Row Totals |
|---|---|---|---|
| Men | 43 | 63 | 106 |
| Women | 95 | 113 | 208 |
| Column Totals | 138 | 176 | 314 |
Using the Chi-Square Test of Independence, researchers test if gender is associated with the likelihood of taking online courses.
3. Political Party Preference by Gender
Another common application is determining if gender is related to political party preference. For instance, a survey of 500 voters is conducted, and the results are summarized as follows:
| Gender | Republican | Democrat | Independent | Row Totals |
|---|---|---|---|---|
| Male | 120 | 90 | 40 | 250 |
| Female | 110 | 95 | 45 | 250 |
| Column Totals | 230 | 185 | 85 | 500 |
The Chi-Square Test of Independence is used to determine whether there is a significant association between gender and political party preference.
Steps to Conduct the Chi-Square Test
- State the Hypotheses:
- Null hypothesis (\(H_0\)): The two variables are independent.
- Alternative hypothesis (\(H_a\)): The two variables are not independent.
- Calculate the Expected Frequencies:
Use the formula: \( E = \frac{(\text{row total} \times \text{column total})}{\text{grand total}} \)
- Compute the Chi-Square Statistic:
Use the formula: \( \chi^2 = \sum \frac{(O - E)^2}{E} \), where \(O\) is the observed frequency and \(E\) is the expected frequency.
- Determine the Degrees of Freedom:
Calculate as \( (\text{number of rows} - 1) \times (\text{number of columns} - 1) \).
- Find the p-value and Compare to Significance Level:
If the p-value is less than the chosen significance level (e.g., 0.05), reject the null hypothesis.
These examples and steps illustrate how the Chi-Square Test of Independence can be applied in various scenarios to test for associations between categorical variables.
Software Tools for Chi-Square Test
Several software tools can help you perform the Chi-Square Test of Independence efficiently. These tools offer various features, including data input, calculation, and result interpretation. Here are some popular options:
- SPSS
SPSS is a powerful statistical software widely used in social sciences. To perform a Chi-Square test in SPSS:
- Enter your data into the data editor.
- Click on Analyze > Descriptive Statistics > Crosstabs.
- Drag your categorical variables into the Rows and Columns boxes.
- Click on Statistics and check the Chi-square box.
- Click OK to run the test and view the output, which includes the Chi-Square statistic, degrees of freedom, and p-value.
- R
R is an open-source software environment for statistical computing. To perform a Chi-Square test in R:
- Load your data into a dataframe.
- Use the
chisq.test()function to perform the test. For example: - Interpret the output, which includes the Chi-Square statistic, degrees of freedom, and p-value.
chisq.test(table(data$variable1, data$variable2)) - Excel
Excel provides a straightforward way to perform the Chi-Square test using the Data Analysis Toolpak:
- Ensure the Data Analysis Toolpak is enabled.
- Organize your data in a contingency table format.
- Click on Data > Data Analysis > Chi-Square Test.
- Select the range for your contingency table and specify the expected frequencies.
- Excel will output the Chi-Square statistic and p-value, along with other relevant statistics.
- Python (SciPy)
Python, with its SciPy library, is a popular choice for statistical analysis. To perform a Chi-Square test in Python:
- Install SciPy if you haven't already:
- Load your data and use the
chi2_contingencyfunction: - Interpret the output, which includes the Chi-Square statistic, p-value, degrees of freedom, and expected frequencies.
pip install scipyfrom scipy.stats import chi2_contingency data = [[10, 20], [30, 40]] chi2, p, dof, expected = chi2_contingency(data)
These tools simplify the process of performing the Chi-Square test, from data input to interpretation of results, making statistical analysis accessible to users with varying levels of expertise.
Common Mistakes and Pitfalls
Conducting a Chi-Square Test involves several steps where errors commonly occur. Here, we outline these potential pitfalls and provide guidance on how to avoid them:
- Incorrect Assumptions:
- Ensure your data is categorical. The Chi-Square Test is not appropriate for continuous data.
- Verify that the categories are mutually exclusive and exhaustive. Each observation should fit into one and only one category.
- Sample Size Issues:
- A small sample size can lead to inaccurate results. It is generally recommended that the expected frequency in each cell of the contingency table should be 5 or more.
- If the sample size is too small, consider using Fisher’s Exact Test as an alternative.
- Data Preparation Errors:
- Always use raw frequencies rather than percentages or other transformations.
- Double-check the data entries for accuracy to ensure there are no typographical errors or misclassifications.
- Misinterpreting the Null Hypothesis:
- Remember, the null hypothesis in a Chi-Square Test of Independence posits that there is no association between the variables. A significant result indicates that the variables are not independent.
- In a Goodness-of-Fit test, the null hypothesis suggests that the observed frequencies match the expected frequencies based on a specified distribution.
- Ignoring Assumptions about Expected Frequencies:
- Ensure that no more than 20% of expected frequencies are less than 5, and none are less than 1.
- If these conditions are not met, the Chi-Square approximation may not be valid, leading to unreliable results.
- Overlooking the Degrees of Freedom:
- Correctly calculate the degrees of freedom, which is critical for finding the appropriate critical value from the Chi-Square distribution table.
- For a Test of Independence, degrees of freedom are calculated as \((r-1) \times (c-1)\), where \(r\) is the number of rows and \(c\) is the number of columns.
- Improper Use of Continuity Correction:
- For 2x2 tables, consider using Yates' continuity correction to adjust for the overestimation of statistical significance.
By understanding and avoiding these common mistakes, you can ensure that your Chi-Square Test results are accurate and reliable.
Additional Resources and Tutorials
For those interested in further exploring the Chi-Square Test of Independence, the following resources and tutorials provide in-depth information and practical examples:
- Khan Academy:
Khan Academy offers comprehensive video tutorials that cover the basics and advanced concepts of the Chi-Square test. These tutorials include step-by-step explanations and practical examples to help you understand how to perform and interpret the test.
- Statology:
Statology provides real-life examples of how the Chi-Square test is applied in various scenarios. It also offers calculators for both Chi-Square Goodness of Fit Test and Chi-Square Test of Independence, which can be helpful for performing calculations without manual effort.
- Scribbr:
Scribbr’s guides and tutorials on the Chi-Square test of independence include detailed explanations, formulas, and step-by-step instructions on how to calculate the test statistic. They also provide examples of contingency tables and how to use them effectively in your analysis.
These resources not only provide theoretical knowledge but also practical tools and examples to enhance your understanding of the Chi-Square Test of Independence. Whether you are a student, researcher, or professional, these tutorials will help you gain a deeper insight into this statistical test and its applications.
Video hướng dẫn chi tiết về kiểm định Chi-Square, bao gồm cả ví dụ về giả thuyết không. Phù hợp cho người học thống kê và nghiên cứu.
Kiểm Định Chi-Square
READ MORE:
Video hướng dẫn về thống kê Chi-Square trong kiểm định giả thuyết, phù hợp cho học sinh AP và những người quan tâm đến thống kê.
Thống Kê Chi-Square cho Kiểm Định Giả Thuyết | Thống Kê AP | Khan Academy

:max_bytes(150000):strip_icc()/Chi-SquareStatistic_Final_4199464-7eebcd71a4bf4d9ca1a88d278845e674.jpg)