Topic chi squared genetics: Explore the role of Chi-Squared tests in genetic research, from basic principles to advanced applications. Learn how this statistical method enhances our understanding of genetic phenomena, with practical examples and insights into interpreting results. Discover essential tools and avoid common pitfalls in genetic Chi-Squared analysis.
Table of Content
- Chi-Square Test in Genetics
- Introduction to Chi-Squared Test in Genetics
- Applications of Chi-Squared Test
- Goodness-of-Fit Test in Genetics
- Steps for Performing Chi-Squared Test
- Interpreting Chi-Squared Results
- Examples and Case Studies
- Comparisons with Other Statistical Tests
- Software and Tools for Chi-Squared Analysis
- Advanced Topics in Genetic Chi-Squared Analysis
- Common Pitfalls and Solutions
- YOUTUBE: Kiểm định Chi-squared - Sinh học cấp độ 16 (A Level, Pre-U, IB, AP Bio)
Chi-Square Test in Genetics
The chi-square test is a statistical method widely used in genetics to test the goodness of fit between observed data and data expected based on a specific hypothesis. This test helps in determining whether deviations from expected ratios are due to random chance or if they indicate a significant difference.
Formula
The formula for the chi-square test statistic is:
\[ \chi^2 = \sum \frac{(O_i - E_i)^2}{E_i} \]
where \( O_i \) represents the observed frequency, and \( E_i \) represents the expected frequency.
Applications in Genetics
In genetics, the chi-square test is commonly used to analyze data from Mendelian inheritance patterns, such as testing the fit to expected ratios in monohybrid or dihybrid crosses.
Example: Mendelian Genetics
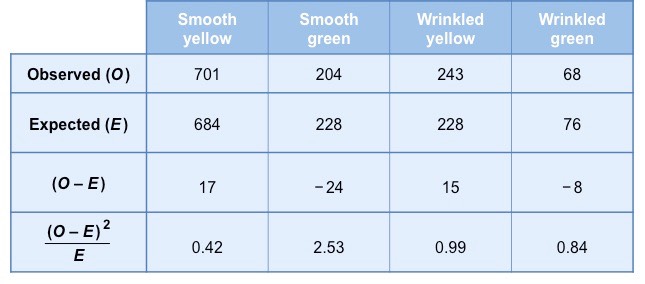
Let's consider a classic example of a dihybrid cross where we expect a 9:3:3:1 ratio among the offspring:
| Phenotype | Observed (O) | Expected (E) | (O - E)^2 / E |
|---|---|---|---|
| Round, Yellow | 315 | 312.75 | 0.016 |
| Round, Green | 108 | 104.25 | 0.134 |
| Wrinkled, Yellow | 101 | 104.25 | 0.101 |
| Wrinkled, Green | 32 | 34.75 | 0.218 |
Total \( \chi^2 \) value = 0.47
If the chi-square value calculated is less than the critical value from the chi-square table (at a specific degree of freedom and significance level, typically 0.05), we accept the null hypothesis, suggesting that the observed data fits the expected ratio well.
Chi-Square Table
| Degrees of Freedom (df) | 0.05 | 0.01 |
|---|---|---|
| 1 | 3.84 | 6.64 |
| 2 | 5.99 | 9.21 |
| 3 | 7.82 | 11.35 |
Key Points
- The chi-square test helps in testing the goodness of fit for genetic ratios.
- It is used to compare observed data with data expected based on a hypothesis.
- The test can determine if deviations are due to random chance or indicate significant differences.
Conclusion
The chi-square test is a vital tool in genetic research for verifying the consistency of observed genetic data with expected patterns based on Mendelian laws.

READ MORE:
Introduction to Chi-Squared Test in Genetics
The Chi-Squared test is a fundamental statistical method widely used in genetics to assess the significance of observed versus expected distributions of categorical data. In genetics, it helps researchers determine whether observed genotype frequencies differ significantly from expected frequencies based on Mendelian inheritance patterns.
Key aspects of the Chi-Squared test in genetics include:
- Hypothesis Testing: It allows researchers to test hypotheses about the genetic makeup of populations.
- Goodness-of-Fit Test: Used to determine if observed genetic data fit expected ratios.
- Independence Test: Assesses whether two categorical variables (e.g., genotype and phenotype) are independent.
Understanding Chi-Squared tests is crucial for interpreting genetic data, identifying deviations from expected genetic ratios, and investigating the genetic basis of traits and diseases.
Applications of Chi-Squared Test
The Chi-Squared test finds extensive applications in genetics, playing a crucial role in various aspects of genetic research and analysis:
- Genetic Linkage Studies: It helps assess whether genes are inherited together due to genetic linkage.
- Association Studies: Used to investigate the association between genetic variants and phenotypic traits or diseases.
- Population Genetics: Determines deviations from expected genetic frequencies in populations, aiding in understanding genetic diversity.
- Quality Control in Genetic Experiments: Ensures that experimental data conform to expected genetic ratios, validating experimental results.
- Evolutionary Genetics: Analyzes genetic data across generations to study evolutionary processes and genetic drift.
These applications illustrate the versatility and importance of the Chi-Squared test in genetics, enabling researchers to draw meaningful conclusions about genetic relationships, diversity, and inheritance patterns.
Goodness-of-Fit Test in Genetics
The Goodness-of-Fit test, based on the Chi-Squared statistic, is extensively utilized in genetics to evaluate how well observed genetic data fit expected Mendelian ratios or other theoretical distributions. Here’s how it is applied:
- Expected Ratios: Researchers define expected genotype frequencies based on Mendelian genetics or other theoretical models.
- Observed Data: Actual genotype frequencies from genetic experiments or surveys are collected.
- Calculation of Chi-Squared Statistic: The Chi-Squared test calculates a statistic that compares observed and expected frequencies to assess whether any significant differences exist.
- Interpretation: By comparing the calculated Chi-Squared value to a critical value from the Chi-Squared distribution, researchers determine whether the observed data fit the expected distribution adequately.
The Goodness-of-Fit test ensures that genetic experiments adhere to expected genetic ratios, providing confidence in the validity of genetic hypotheses and experimental results.
Steps for Performing Chi-Squared Test
Performing a Chi-Squared test in genetics involves several clear steps to ensure accurate analysis and interpretation:
- Formulate Hypotheses: Define null and alternative hypotheses regarding expected genotype frequencies.
- Data Collection: Gather observed genotype frequencies from genetic experiments or studies.
- Expected Frequencies Calculation: Calculate expected genotype frequencies based on theoretical models (e.g., Mendelian genetics).
- Construct Contingency Table: Organize observed and expected frequencies into a contingency table.
- Calculate Chi-Squared Statistic: Compute the Chi-Squared statistic using the formula Χ² = Σ [(O - E)² / E], where O is observed frequency and E is expected frequency.
- Determine Degrees of Freedom: Calculate degrees of freedom based on the number of categories (genotypes - 1).
- Compare with Critical Value: Compare the calculated Chi-Squared value with the critical value from the Chi-Squared distribution table at a given significance level (usually 0.05).
- Interpret Results: Determine whether to accept or reject the null hypothesis based on the comparison.
Following these steps ensures systematic and reliable Chi-Squared test application in genetic research, aiding in the validation of genetic hypotheses and understanding of inheritance patterns.
Interpreting Chi-Squared Results
Interpreting Chi-Squared results in genetics involves several critical steps to derive meaningful conclusions from statistical analyses:
- Compare Chi-Squared Value: Compare the calculated Chi-Squared value with the critical value from the Chi-Squared distribution table at a chosen significance level (e.g., 0.05).
- Assess Degrees of Freedom: Consider the degrees of freedom, which affect the critical Chi-Squared value.
- Accept or Reject Null Hypothesis: If the calculated Chi-Squared value is less than the critical value, accept the null hypothesis (observed frequencies fit expected frequencies). If it exceeds the critical value, reject the null hypothesis (observed frequencies differ significantly from expected).
- Consider Practical Significance: Even if statistical significance is achieved, assess whether the observed deviation from expected frequencies is practically significant in genetic terms.
- Review Assumptions: Ensure that assumptions underlying the Chi-Squared test (e.g., independence of observations) are met.
Interpreting Chi-Squared results accurately is crucial for drawing valid conclusions about genetic data, ensuring robustness in genetic research findings.
Examples and Case Studies
Here are some examples and case studies illustrating the application of the Chi-Squared test in genetics:
-
Example 1: Genetic Cross in Drosophila
A study on inheritance patterns of eye color in Drosophila melanogaster used a Chi-Squared test to assess the fit of observed versus expected ratios. The experiment involved crossing flies with different eye color mutations and counting offspring.
-
Example 2: Population Genetics
In a population genetics study, researchers analyzed the distribution of genotypes at a specific locus in a population of birds. The Chi-Squared test helped determine whether the observed genotype frequencies deviated significantly from Hardy-Weinberg equilibrium.
-
Case Study: Disease Association
Investigating the association between a genetic variant and disease susceptibility in a human population involved using Chi-Squared analysis. By comparing allele frequencies between affected and unaffected individuals, researchers evaluated the genetic contribution to disease risk.
Comparisons with Other Statistical Tests
Here is a comparison of the Chi-Squared test with other statistical tests commonly used in genetics:
| Statistical Test | Purpose | Applicability | Key Differences |
|---|---|---|---|
| Chi-Squared Test | Assessing categorical data and expected versus observed frequencies. | Commonly used in genetics for analyzing genotype frequencies, allele distributions, and trait inheritance. | Non-parametric test suitable for categorical data; evaluates goodness-of-fit and independence. |
| Student's t-test | Comparing means between two groups. | Used when comparing quantitative measurements, such as expression levels or trait values. | Parametric test assuming normal distribution; sensitive to sample size and variance. |
| ANOVA (Analysis of Variance) | Comparing means among three or more groups. | Applicable when comparing multiple groups or factors affecting a trait or phenotype. | Parametric test assessing variance among groups; requires assumptions of normality and homogeneity of variances. |
| Fisher's Exact Test | Analyzing small sample sizes or rare events. | Used when expected frequencies are low or sample sizes are small. | Non-parametric test providing exact p-values; suitable for 2x2 contingency tables. |
Software and Tools for Chi-Squared Analysis
Various software and tools are available for performing Chi-Squared analysis in genetics:
- R Statistical Software: R provides comprehensive packages like
statsandgmodelsfor Chi-Squared tests, along with graphical capabilities for data visualization. - SPSS (Statistical Package for the Social Sciences): SPSS offers a user-friendly interface for conducting Chi-Squared tests, suitable for both beginners and advanced users in genetics research.
- SAS (Statistical Analysis System): SAS includes procedures for Chi-Squared analysis in its base software, enabling efficient handling of large datasets and complex statistical models.
- Python: Python libraries such as
scipy.statsandstatsmodelsprovide functions for Chi-Squared tests, ideal for integrating statistical analysis into computational biology workflows. - Excel: Microsoft Excel offers Chi-Squared test functionality through its Data Analysis Toolpak, allowing users to perform basic statistical tests directly within spreadsheet environments.

Advanced Topics in Genetic Chi-Squared Analysis
Explore advanced topics in Chi-Squared analysis specific to genetics:
-
Linkage Disequilibrium Analysis
Using Chi-Squared tests to assess the association between alleles at different loci within populations, aiding in understanding genetic linkage and evolutionary relationships.
-
Genetic Association Studies
Applying Chi-Squared analysis to investigate the relationship between genetic variants and phenotypic traits or diseases in diverse populations, often involving large-scale genomic data.
-
Quantitative Trait Locus (QTL) Mapping
Utilizing Chi-Squared tests to identify regions of the genome influencing quantitative traits, facilitating the mapping of genetic markers linked to complex phenotypes.
-
Multi-Locus Association Tests
Advanced Chi-Squared methodologies that integrate data from multiple genetic loci to assess joint effects on phenotypic variation, enhancing insights into polygenic traits and gene interactions.
Common Pitfalls and Solutions
Identify common challenges in Chi-Squared analysis in genetics and their solutions:
-
Small Sample Sizes
Problem: Insufficient sample sizes can lead to unreliable Chi-Squared results.
Solution: Ensure adequate sample sizes to achieve statistical power; consider pooling data from multiple studies if necessary.
-
Violation of Assumptions
Problem: Assumptions such as independence of observations or expected frequencies can be violated.
Solution: Verify assumptions through exploratory data analysis; consider alternative tests like Fisher's Exact test for small expected frequencies.
-
Misinterpretation of Results
Problem: Incorrect interpretation of p-values or statistical significance.
Solution: Clearly define hypotheses before analysis; interpret results in the context of study design and biological relevance.
-
Biological Variability
Problem: Genetic diversity or environmental factors influencing study outcomes.
Solution: Control for confounding variables; consider stratified analysis or matching techniques to minimize variability.
Kiểm định Chi-squared - Sinh học cấp độ 16 (A Level, Pre-U, IB, AP Bio)
Kiểm định Chi-squared - Sinh học cấp độ 16 (A Level, Pre-U, IB, AP Bio)
READ MORE:
Kiểm định Chi Square và Các Vấn Đề Di truyền
Kiểm định Chi Square và Các Vấn Đề Di truyền
:max_bytes(150000):strip_icc()/Chi-SquareStatistic_Final_4199464-7eebcd71a4bf4d9ca1a88d278845e674.jpg)