Topic x squared graph: The x squared graph, represented by the equation \(y = x^2\), is a fundamental concept in algebra and geometry. This article explores the characteristics of the x squared graph, its properties, transformations, and practical applications, providing a comprehensive understanding to help you visualize and utilize quadratic functions effectively.
Table of Content
- Understanding the X-Squared Graph
- Introduction
- Understanding the X Squared Graph
- Graphing Quadratic Functions
- Properties of the Parabola
- Vertex Form of a Quadratic Equation
- Axis of Symmetry and Vertex
- Focus and Directrix
- Transformations of the X Squared Graph
- Applications of Quadratic Graphs
- Examples and Practice Problems
- Interactive Graphing Tools
- YOUTUBE:
Understanding the X-Squared Graph
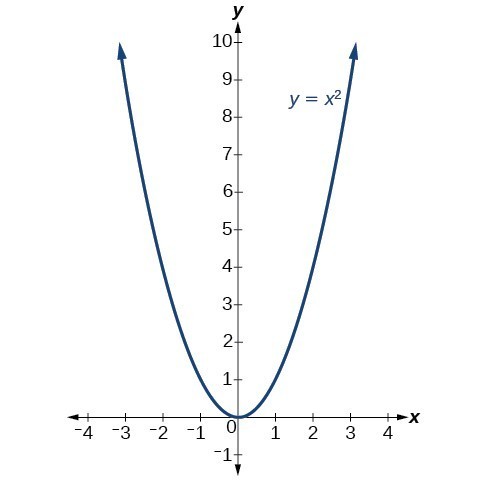
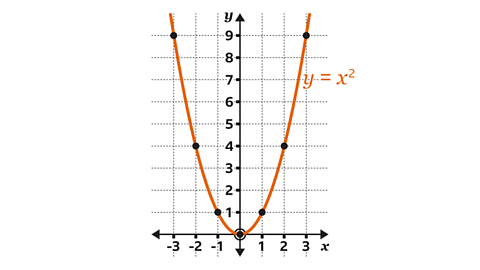
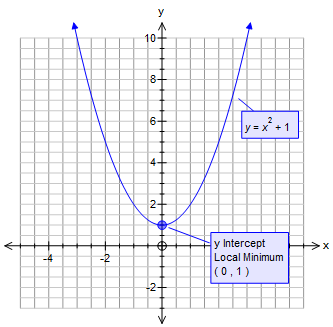
The graph of the equation \( y = x^2 \) is a fundamental concept in algebra, representing a quadratic function. This graph forms a parabola, a U-shaped curve that opens upwards.
Characteristics of the X-Squared Graph
- The vertex of the parabola is at the origin (0,0).
- The axis of symmetry is the y-axis, meaning the graph is symmetrical around this line.
- As \( x \) moves away from zero, the value of \( y \) increases quadratically.
Equation Forms and Transformations
The standard form of a quadratic equation is:
\[ y = ax^2 + bx + c \]
Where:
- \( a \) determines the width and direction of the parabola (upwards if \( a > 0 \), downwards if \( a < 0 \)).
- \( b \) controls the horizontal placement of the vertex.
- \( c \) represents the y-intercept.
Vertex Form
The vertex form of a quadratic equation provides a more intuitive understanding of the graph's shape and position:
\[ y = a(x-h)^2 + k \]
Here, \((h, k)\) is the vertex of the parabola.
Example Graphing
Consider the quadratic equation:
\[ y = 2x^2 - 12x + 16 \]
To convert this to vertex form, we first find the vertex \((h, k)\):
- Calculate \( h \) using \( h = -\frac{b}{2a} \):
\[ h = -\frac{-12}{2 \times 2} = 3 \] - Find \( k \) by substituting \( h \) back into the equation:
\[ k = 2(3)^2 - 12(3) + 16 = -2 \]
The vertex is (3, -2), and the equation in vertex form is:
\[ y = 2(x-3)^2 - 2 \]
Using Graphing Tools
Online tools like Desmos and Symbolab offer interactive graphing calculators that can help visualize and manipulate quadratic functions easily.
These tools are valuable for experimenting with different values of \( a \), \( b \), and \( c \), and seeing their effects on the graph of the equation.
Conclusion
Understanding the graph of \( y = x^2 \) and its transformations is crucial in algebra. Whether you're plotting by hand or using graphing calculators, mastering these concepts provides a strong foundation for further mathematical studies.

READ MORE:
Introduction
The graph of \( y = x^2 \) is one of the most fundamental and widely recognized shapes in mathematics, representing a parabola. This quadratic function is characterized by its U-shaped curve which opens upwards, symmetrically around the y-axis. The vertex of the graph is at the origin (0,0), and it extends infinitely in both directions along the y-axis as x values increase positively and negatively.
In this section, we will explore the properties, transformations, and practical applications of the \( y = x^2 \) graph. Understanding this basic quadratic function lays the groundwork for more complex algebraic operations and graphing techniques used in various fields such as physics, engineering, and economics.
- The basic form of the quadratic function is \( y = x^2 \), where the coefficient of \( x^2 \) is 1.
- Transformations such as vertical and horizontal shifts, stretching, and reflections are applied to modify the graph.
- Real-world applications include projectile motion, optimization problems, and curve fitting in data analysis.
Understanding the X Squared Graph
The graph of \(y = x^2\) is one of the most fundamental and easily recognizable parabolas in mathematics. This parabola opens upwards, with its vertex at the origin (0,0). The graph is symmetrical about the y-axis, making it a perfect example of an even function.
Key features of the \(y = x^2\) graph include:
- Vertex: The highest or lowest point of the parabola. For \(y = x^2\), the vertex is at (0,0).
- Axis of Symmetry: A vertical line that divides the parabola into two mirror images. For \(y = x^2\), this line is \(x = 0\).
- Focus: A point inside the parabola where all the reflected lines converge. For \(y = x^2\), the focus is at (0,0.25).
- Directrix: A horizontal line opposite to the focus that is perpendicular to the axis of symmetry. For \(y = x^2\), the directrix is \(y = -0.25\).
- Latus Rectum: A line segment that passes through the focus and is perpendicular to the axis of symmetry. For \(y = x^2\), the length of the latus rectum is 1.
To graph \(y = x^2\), follow these steps:
- Identify the vertex, which is (0,0).
- Draw the axis of symmetry, which is the y-axis (x = 0).
- Plot several points on either side of the vertex by choosing x-values and calculating the corresponding y-values.
- Draw a smooth curve through the points to complete the parabola.
This basic understanding of the \(y = x^2\) graph serves as a foundation for exploring more complex quadratic equations and their graphs.
Graphing Quadratic Functions
Graphing quadratic functions involves plotting the standard form of a quadratic equation, which is typically expressed as \( y = ax^2 + bx + c \). The graph of a quadratic function is a parabola that can open upwards or downwards depending on the coefficient \( a \).
Here are the steps to graph a quadratic function:
- Identify the coefficients \( a \), \( b \), and \( c \) in the quadratic equation \( y = ax^2 + bx + c \).
- Calculate the vertex of the parabola using the formula \( h = -\frac{b}{2a} \) for the x-coordinate and \( k = f(h) \) for the y-coordinate.
- Determine the axis of symmetry, which is the vertical line \( x = h \).
- Find the y-intercept, which is the point \( (0, c) \).
- Plot additional points on either side of the vertex by choosing x-values and calculating the corresponding y-values.
- Draw the parabola by connecting the points smoothly, ensuring it is symmetrical around the axis of symmetry.
For example, to graph the function \( y = 2x^2 - 4x + 1 \), follow these steps:
- Identify the coefficients: \( a = 2 \), \( b = -4 \), \( c = 1 \).
- Calculate the vertex: \( h = -\frac{-4}{2 \cdot 2} = 1 \) and \( k = 2(1)^2 - 4(1) + 1 = -1 \). So, the vertex is \( (1, -1) \).
- The axis of symmetry is \( x = 1 \).
- The y-intercept is \( (0, 1) \).
- Choose additional x-values (e.g., \( x = 2 \) and \( x = 3 \)), and calculate their y-values: \( y = 2(2)^2 - 4(2) + 1 = 1 \) and \( y = 2(3)^2 - 4(3) + 1 = 7 \).
- Plot the points \( (1, -1) \), \( (0, 1) \), \( (2, 1) \), and \( (3, 7) \), and draw the parabola.
By following these steps, you can graph any quadratic function and understand its characteristics, such as the direction it opens, its vertex, and its axis of symmetry.
Properties of the Parabola
A parabola is a U-shaped curve that is the graph of a quadratic function. Understanding the properties of a parabola is essential for graphing quadratic functions and solving related problems. Here are the key properties and components of a parabola:
- Vertex: The highest or lowest point on the graph, depending on whether the parabola opens upward or downward. The vertex is located at the point \((h, k)\) in the vertex form of the equation \(y = a(x-h)^2 + k\).
- Axis of Symmetry: A vertical line that passes through the vertex and divides the parabola into two symmetrical halves. The equation of the axis of symmetry is \(x = h\).
- Focus: A point inside the parabola used to define the curve. The distance from the vertex to the focus is denoted as \(p\), and it helps in determining the shape of the parabola.
- Directrix: A line perpendicular to the axis of symmetry located \(p\) units from the vertex in the opposite direction of the focus. The equation of the directrix is \(y = k - p\) for a parabola opening upwards or downwards.
- Focal Length: The distance between the focus and the directrix, which is \(2p\). It influences the "width" of the parabola.
- Opening Direction: Determined by the coefficient \(a\) in the quadratic equation \(y = ax^2 + bx + c\). If \(a > 0\), the parabola opens upward. If \(a < 0\), it opens downward.
- Intercepts: Points where the parabola intersects the x-axis and y-axis. The y-intercept is found by evaluating the function at \(x = 0\), and the x-intercepts are found by solving the equation \(ax^2 + bx + c = 0\).
By understanding these properties, you can accurately graph and analyze parabolas, solving quadratic equations and optimizing quadratic functions effectively.
Vertex Form of a Quadratic Equation
The vertex form of a quadratic equation provides a direct way to identify the vertex of the parabola represented by the equation. The vertex form is expressed as:
Here, \( (h, k) \) represents the vertex of the parabola. The process to convert a standard quadratic equation \( y = ax^2 + bx + c \) to vertex form involves completing the square:
- Extract \( a \) from the first two terms: \( y = a(x^2 + \frac{b}{a}x) + c \).
- Add and subtract \( (\frac{b}{2a})^2 \) inside the bracket: \( y = a(x^2 + \frac{b}{a}x + (\frac{b}{2a})^2 - (\frac{b}{2a})^2) + c \).
- Rewrite using the perfect square trinomial: \( y = a((x + \frac{b}{2a})^2 - (\frac{b}{2a})^2) + c \).
- Expand and simplify: \( y = a(x + \frac{b}{2a})^2 - \frac{b^2}{4a} + c \).
The vertex form is then \( y = a(x - h)^2 + k \) where \( h = -\frac{b}{2a} \) and \( k = c - \frac{b^2}{4a} \).
This form is useful for graphing because it easily shows the vertex and the direction of the parabola (upward if \( a > 0 \), downward if \( a < 0 \)). By manipulating the values of \( h \) and \( k \), one can shift the graph horizontally and vertically, respectively.
For example, given the quadratic equation \( y = 2x^2 - 4x + 1 \), converting to vertex form involves:
- Extracting \( a \): \( y = 2(x^2 - 2x) + 1 \).
- Completing the square: \( y = 2(x^2 - 2x + 1 - 1) + 1 \).
- Rewriting: \( y = 2((x - 1)^2 - 1) + 1 \).
- Simplifying: \( y = 2(x - 1)^2 - 2 + 1 \), which gives \( y = 2(x - 1)^2 - 1 \).
Thus, the vertex form is \( y = 2(x - 1)^2 - 1 \), indicating the vertex is at \( (1, -1) \) and the parabola opens upwards.
Axis of Symmetry and Vertex
The axis of symmetry of a parabola is a vertical line that divides the parabola into two mirror-image halves. This line passes through the vertex of the parabola and can be found using specific formulas depending on the form of the quadratic equation.
- If the quadratic equation is in standard form \(y = ax^2 + bx + c\), the axis of symmetry is given by the formula \(x = -\frac{b}{2a}\).
- If the quadratic equation is in vertex form \(y = a(x-h)^2 + k\), the axis of symmetry is simply \(x = h\).
The vertex of the parabola, which is the highest or lowest point on the graph depending on the orientation, is located on the axis of symmetry.
Example
For a quadratic function in standard form \(y = x^2 - 6x + 8\):
- Find the axis of symmetry using \(x = -\frac{b}{2a}\):
- Here, \(a = 1\), \(b = -6\)
- Axis of symmetry: \(x = -\frac{-6}{2 \cdot 1} = 3\)
- Find the vertex by substituting \(x = 3\) back into the equation:
- \(y = (3)^2 - 6(3) + 8 = 9 - 18 + 8 = -1\)
- Vertex: \((3, -1)\)
Understanding the axis of symmetry and the vertex is crucial in graphing and analyzing quadratic functions, as they provide valuable information about the shape and position of the parabola on the coordinate plane.
Focus and Directrix
In the study of quadratic functions and parabolas, the concepts of the focus and directrix are crucial for understanding the geometric properties of these curves. The focus and directrix provide a unique way to define and construct a parabola.
A parabola is the set of all points \((x, y)\) that are equidistant from a fixed point called the focus and a line called the directrix. This definition can be expressed mathematically using the distance formula.
Standard Equation of a Parabola
The standard form of a parabola that opens upwards or downwards is:
\[ y = ax^2 + bx + c \]
However, when considering the focus and directrix, it is often useful to use the vertex form:
\[ (x - h)^2 = 4p(y - k) \]
where \((h, k)\) is the vertex of the parabola, and \(p\) is the distance from the vertex to the focus and also from the vertex to the directrix.
Finding the Focus and Directrix
To find the focus and directrix of a parabola given by \((x - h)^2 = 4p(y - k)\):
- The vertex of the parabola is at \((h, k)\).
- The focus is located at \((h, k + p)\).
- The directrix is the horizontal line \(y = k - p\).
For a parabola that opens to the left or right, the equation is:
\[ (y - k)^2 = 4p(x - h) \]
- The vertex is at \((h, k)\).
- The focus is located at \((h + p, k)\).
- The directrix is the vertical line \(x = h - p\).
Example
Consider the parabola given by the equation \((x - 2)^2 = 8(y + 3)\). To find its focus and directrix:
- Rewrite the equation in standard form to identify the values of \(h\), \(k\), and \(p\):
\((x - 2)^2 = 4 \cdot 2(y + 3)\), hence \(h = 2\), \(k = -3\), and \(p = 2\). - Determine the vertex: \((h, k) = (2, -3)\).
- Calculate the focus: \( (h, k + p) = (2, -3 + 2) = (2, -1)\).
- Determine the directrix: \(y = k - p = -3 - 2 = -5\).
Thus, the focus is at \((2, -1)\) and the directrix is the line \(y = -5\).
Visualizing the Focus and Directrix
Visualizing these elements can help in understanding their geometric relationship:
- The parabola is symmetric with respect to the line passing through the focus and perpendicular to the directrix.
- Every point on the parabola is equidistant from the focus and the directrix.
Understanding the focus and directrix not only helps in graphing parabolas but also provides insights into their reflective properties, which are utilized in various applications such as satellite dishes and headlights.
Transformations of the X Squared Graph
The graph of the quadratic function \(f(x) = x^2\) can undergo several transformations, including translations, reflections, and scaling. These transformations alter the graph's position and shape in the coordinate plane.
Vertical and Horizontal Translations
Translations shift the graph without changing its shape. There are two types of translations:
- Vertical Translations: Adding or subtracting a constant \(k\) to the function shifts the graph up or down.
- Shift up by \(k\) units: \( f(x) = x^2 + k \)
- Shift down by \(k\) units: \( f(x) = x^2 - k \)
- Horizontal Translations: Adding or subtracting a constant \(h\) to the \(x\)-variable shifts the graph left or right.
- Shift left by \(h\) units: \( f(x) = (x + h)^2 \)
- Shift right by \(h\) units: \( f(x) = (x - h)^2 \)
Reflections
Reflections flip the graph over a specified axis:
- Reflection across the x-axis: Multiply the function by \(-1\).
- \( f(x) = -x^2 \)
- Reflection across the y-axis: For quadratic functions, this does not change the graph as it is symmetric about the y-axis.
Vertical and Horizontal Scaling
Scaling changes the graph's width or height:
- Vertical Scaling: Multiply the function by a constant \(a\).
- Vertical stretch by a factor of \(a\) (if \(a > 1\)): \( f(x) = ax^2 \)
- Vertical compression by a factor of \(a\) (if \(0 < a < 1\)): \( f(x) = ax^2 \)
- Horizontal Scaling: Divide the \(x\)-variable by a constant \(b\).
- Horizontal stretch by a factor of \(1/b\) (if \(0 < b < 1\)): \( f(x) = (bx)^2 \)
- Horizontal compression by a factor of \(1/b\) (if \(b > 1\)): \( f(x) = (bx)^2 \)
Combined Transformations
Multiple transformations can be combined. For example, the function \(f(x) = a(x - h)^2 + k\) represents a parabola that has been vertically scaled by \(a\), horizontally translated by \(h\) units, and vertically translated by \(k\) units.
Here's a step-by-step guide for combining transformations:
- Identify vertical and horizontal translations from the formula.
- Apply vertical scaling or compression.
- Apply horizontal scaling or compression.
- Apply translations in any order.
Examples
- Example 1: \( f(x) = 2(x - 3)^2 + 5 \)
- Vertical stretch by a factor of 2.
- Horizontal shift right by 3 units.
- Vertical shift up by 5 units.
- Example 2: \( f(x) = \frac{1}{2}(x + 4)^2 - 2 \)
- Vertical compression by a factor of \(\frac{1}{2}\).
- Horizontal shift left by 4 units.
- Vertical shift down by 2 units.
Applications of Quadratic Graphs
Quadratic graphs are prevalent in various real-world applications. Their parabolic shapes make them useful in modeling scenarios where relationships between variables can be expressed by a second-degree polynomial equation. Here are some notable applications:
-
Projectile Motion
In physics, the path of an object thrown or projected into the air follows a parabolic trajectory. The height \( h \) of the projectile at time \( t \) can be described by the equation:
\( h(t) = -\frac{1}{2}gt^2 + v_0 t + h_0 \) where \( g \) is the acceleration due to gravity, \( v_0 \) is the initial velocity, and \( h_0 \) is the initial height.
-
Optimization Problems
Quadratic equations are used to find the maximum or minimum values in various optimization problems. For example, maximizing profit or minimizing cost in business scenarios often involves quadratic functions.
Consider a company selling a product, where the profit \( P \) is a function of the number of units sold \( x \):
\( P(x) = -ax^2 + bx + c \) The maximum profit occurs at the vertex of the parabola.
-
Physics and Engineering
Quadratic functions are used in physics to describe phenomena such as the force between two charges, which follows Coulomb's law:
\( F = k \frac{q_1 q_2}{r^2} \) Rearranging this formula can lead to a quadratic form, useful for solving problems involving the distances and magnitudes of charges.
-
Economics
In economics, quadratic equations can model cost functions, revenue functions, and profit functions. For instance, the demand curve can be represented as:
\( Q = a - bP \) where \( Q \) is the quantity demanded, \( P \) is the price, and \( a \) and \( b \) are constants. The resulting revenue function is quadratic and can be used to determine the optimal price to maximize revenue.
-
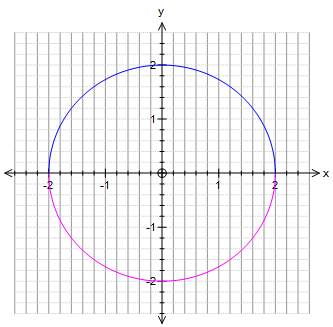
Geometry
Quadratic equations are essential in geometry, especially when dealing with conic sections like circles, ellipses, and parabolas. The Pythagorean theorem itself is a quadratic equation:
\( c^2 = a^2 + b^2 \) where \( c \) is the hypotenuse and \( a \) and \( b \) are the legs of a right triangle.
Examples and Practice Problems
Understanding the x-squared graph, or the graph of a quadratic function, can be greatly enhanced through practice and examples. Below are some solved examples and practice problems to help solidify your understanding.
Solved Examples
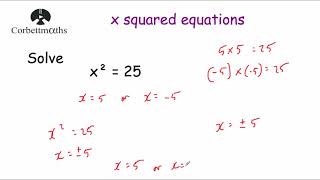
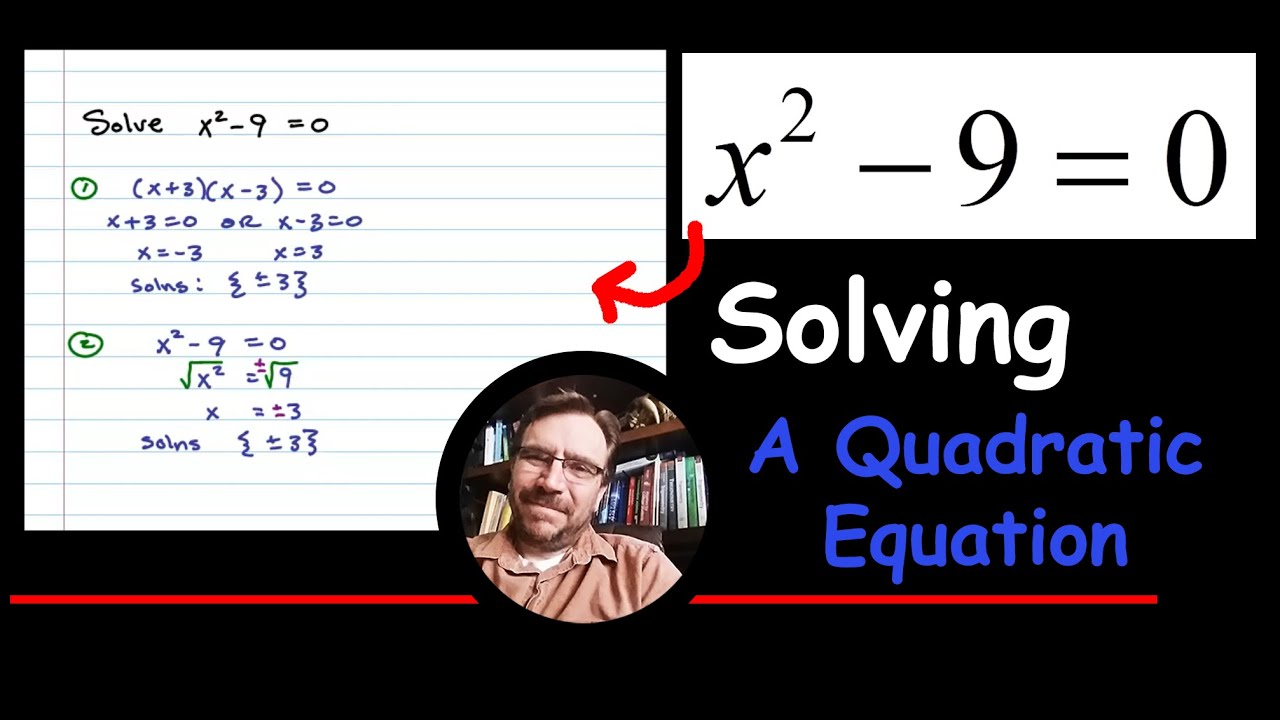
Example 1: Determine the value of x when x2 = 144.
Solution:
To find x, take the square root of both sides:
\[
\begin{aligned}
x &= \pm \sqrt{144} \\
&= \pm 12
\end{aligned}
\]
Therefore, the solutions are \( x = 12 \) and \( x = -12 \).
Example 2: Solve the quadratic equation \(2x^2 - 4x - 6 = 0\).
Solution:
Use the quadratic formula \(x = \frac{-b \pm \sqrt{b^2 - 4ac}}{2a}\), where \(a = 2\), \(b = -4\), and \(c = -6\):
\[
\begin{aligned}
x &= \frac{-(-4) \pm \sqrt{(-4)^2 - 4(2)(-6)}}{2(2)} \\
&= \frac{4 \pm \sqrt{16 + 48}}{4} \\
&= \frac{4 \pm \sqrt{64}}{4} \\
&= \frac{4 \pm 8}{4}
\end{aligned}
\]
This simplifies to:
\[
\begin{aligned}
x &= \frac{12}{4} = 3 \\
x &= \frac{-4}{4} = -1
\end{aligned}
\]
So, the solutions are \(x = 3\) and \(x = -1\).
Example 3: Determine the area of a square with a side length of \(x^2\) meters.
Solution:
The area \(A\) of a square is given by the side length squared:
\[
\begin{aligned}
A &= (x^2)^2 \\
&= x^4 \, \text{square meters}
\end{aligned}
\]
Practice Problems
- What is the value of x when x2 = 256?
- \(\pm 16\)
- \(\pm 14\)
- \(\pm 12\)
- \(\pm 10\)
- Find the roots of the quadratic equation \(x^2 - 7x + 10 = 0\).
- 1 and 10
- 2 and 5
- 3 and 7
- 4 and 6
- Calculate the length of each side of a square whose area is \(x^4\) square units.
- \(x^3\)
- \(x^2\)
- \(x\)
- \(x^8\)
- Solve the quadratic equation \(3x^2 - 12x + 9 = 0\).
- \(x = 1\) or \(x = 3\)
- \(x = 1\) or \(x = -3\)
- \(x = 1\)
- \(x = 3\)
By working through these examples and practice problems, you'll gain a deeper understanding of the properties and applications of quadratic graphs. Quadratic equations are fundamental in many areas of mathematics and their graphical representations, particularly the parabolas, provide valuable insights in both theoretical and applied contexts.
Interactive Graphing Tools
Interactive graphing tools are invaluable for visualizing and understanding the properties and transformations of the \(x^2\) graph and other quadratic functions. Here are some popular and powerful tools available online:
-
Desmos
The Desmos Graphing Calculator is a user-friendly and feature-rich tool that allows you to plot functions, create tables, add sliders to adjust parameters dynamically, and visualize the effects of these changes in real-time. Some key features include:
- Graphing multiple functions simultaneously
- Interactive sliders for parameter adjustments
- Points of interest identification (e.g., intercepts, maxima, minima)
- Audio trace for accessibility
- Sharing and saving graphs online
Visit Desmos:
-
GeoGebra
GeoGebra is another versatile graphing tool that supports a wide range of mathematical functions and geometric constructions. It's ideal for both educators and students. Features include:
- Graphing functions and inequalities
- Dynamic geometry constructions
- Interactive and animated visualizations
- Export options for images and interactive applets
Visit GeoGebra:
-
Symbolab
Symbolab offers a comprehensive graphing calculator that helps users plot functions and solve equations interactively. Its features include:
- Graphing polynomial, trigonometric, and exponential functions
- Displaying critical points and asymptotes
- Interactive function exploration with zoom and pan
- Step-by-step solutions for various math problems
Visit Symbolab:
-
Mathway
Mathway is a comprehensive math problem solver that includes a graphing calculator. It's useful for quickly visualizing solutions and understanding complex functions. Features include:
- Graphing equations and inequalities
- Step-by-step explanations for solutions
- Supports a wide range of mathematical topics
- Available as a mobile app for on-the-go calculations
Visit Mathway:
These interactive tools provide a powerful means to explore and understand quadratic functions, making the learning process both engaging and effective.
Nhanh! Vẽ Đồ Thị y=x Bình Phương
READ MORE:
Toán GCSE - Đồ Thị Bậc Hai Là Gì? #76
x-1=sec(squared)x.jpg)