Topic chi-square test example problems with answers: Discover the essential guide to mastering Chi-Square tests with practical example problems and detailed answers. This comprehensive article covers various aspects of the Chi-Square test, including its application, calculation steps, and real-world examples to enhance your statistical analysis skills. Perfect for students and professionals looking to deepen their understanding of this statistical method.
Table of Content
- Chi-Square Test Example Problems with Answers
- Introduction
- Understanding Chi-Square Tests
- Chi-Square Test Formula
- Chi-Square Goodness of Fit Test
- Chi-Square Test of Independence
- Real-Life Applications
- Additional Resources
- Conclusion
- YOUTUBE: Hướng dẫn chi tiết cách thực hiện kiểm định chi-square bằng tay, phù hợp cho những ai muốn hiểu rõ hơn về phương pháp này và cách áp dụng nó.
Chi-Square Test Example Problems with Answers
The Chi-Square test is a statistical method used to determine if there is a significant association between two categorical variables. Here are some example problems and their solutions:
Example 1: Gender and Political Party Preference
Suppose we want to know if gender has anything to do with political party preference. We poll 440 voters in a simple random sample. The results are as follows:
| Republican | Democrat | Independent | Total | |
|---|---|---|---|---|
| Male | 100 | 70 | 30 | 200 |
| Female | 140 | 60 | 20 | 220 |
| Total | 240 | 130 | 50 | 440 |
We perform a Chi-Square test to verify the assumed theory.
- Null Hypothesis \( (H_0) \): There is no link between gender and political party preference.
- Alternative Hypothesis \( (H_1) \): There is a link between gender and political party preference.
Calculate the expected frequencies:
Expected Value = \( \frac{(Row \, Total) \times (Column \, Total)}{Total \, Number \, of \, Observations} \)
| Republican | Democrat | Independent | Total | |
|---|---|---|---|---|
| Male | 109 | 59 | 32 | 200 |
| Female | 131 | 71 | 18 | 220 |
| Total | 240 | 130 | 50 | 440 |
Calculate the Chi-Square statistic using the formula:
\( \chi^2 = \sum \frac{(O_i - E_i)^2}{E_i} \)
| Republican | Democrat | Independent | Total | |
|---|---|---|---|---|
| Male | 0.743 | 2.051 | 0.0625 | 2.8565 |
| Female | 0.402 | 0.929 | 3.962 | 5.293 |
| Total | 1.145 | 2.980 | 4.0245 | 8.1495 |
The calculated Chi-Square statistic \( \chi^2 = 8.15 \).
Degrees of freedom: \( (r-1) \times (c-1) = (2-1) \times (3-1) = 2 \)
For an alpha level of 0.05 and 2 degrees of freedom, the critical value is 5.991.
Since \( \chi^2 = 8.15 \) is greater than the critical value of 5.991, we reject the null hypothesis and conclude that there is an association between gender and political party preference.
Example 2: Deer Species Distribution
Suppose a biologist claims that an equal number of four different species of deer enter a certain wooded area in a forest each week. The observed frequencies over one week are:
- Species 1: 22
- Species 2: 20
- Species 3: 23
- Species 4: 35
We use a Chi-Square Goodness of Fit Test to determine if the observed frequencies are consistent with the hypothesized equal distribution.
Expected frequency for each species: \( \frac{100}{4} = 25 \)
| Species | Observed (O) | Expected (E) | (O - E)^2 / E |
|---|---|---|---|
| 1 | 22 | 25 | 0.36 |
| 2 | 20 | 25 | 1.00 |
| 3 | 23 | 25 | 0.16 |
| 4 | 35 | 25 | 4.00 |
The calculated Chi-Square statistic \( \chi^2 = 5.52 \).
Degrees of freedom: \( k-1 = 4-1 = 3 \)
For an alpha level of 0.05 and 3 degrees of freedom, the critical value is 7.815.
Since \( \chi^2 = 5.52 \) is less than the critical value of 7.815, we do not reject the null hypothesis and conclude that the observed frequencies are consistent with the hypothesized equal distribution.

READ MORE:
Introduction
The chi-square test is a powerful statistical tool used to examine the relationship between categorical variables. It helps determine if there is a significant association between observed and expected frequencies in different categories. Chi-square tests are widely used in various fields such as biology, marketing, and social sciences to test hypotheses and draw conclusions based on sample data.
This guide provides a comprehensive overview of chi-square tests, including the chi-square goodness of fit test and the chi-square test of independence. You will learn about their purposes, how to formulate hypotheses, and the steps involved in performing these tests. We also provide detailed example problems with step-by-step solutions to help you understand the application of these tests in real-life scenarios.
By the end of this guide, you will be equipped with the knowledge to conduct chi-square tests independently, interpret the results, and apply them to your own data analysis projects. Whether you are a student, researcher, or professional, mastering chi-square tests will enhance your analytical skills and enable you to make data-driven decisions with confidence.
Understanding Chi-Square Tests
The chi-square test is a statistical method used to determine whether there is a significant association between categorical variables. This test compares the observed frequencies in each category to the expected frequencies, which are calculated based on the assumption that there is no association between the variables.
Types of Chi-Square Tests
- Chi-Square Goodness of Fit Test: This test determines if a sample data matches a population with a specific distribution. For example, testing if a die is fair by comparing the observed frequency of each number to the expected frequency.
- Chi-Square Test of Independence: This test assesses whether two categorical variables are independent. For instance, checking if there is a relationship between gender and political party preference.
Chi-Square Test Formula
The formula for the chi-square test statistic is:
\[
\chi^2 = \sum \frac{(O_i - E_i)^2}{E_i}
\]
Where \(O_i\) represents the observed frequency, and \(E_i\) represents the expected frequency for the i-th category.
Steps to Perform a Chi-Square Test
- State the Hypotheses: Define the null hypothesis (H0) and the alternative hypothesis (H1). For the test of independence, H0 usually states that there is no association between the variables.
- Calculate Expected Frequencies: For each category, calculate the expected frequency using the formula: \[ E_i = \frac{(Row \,\, total \times Column \,\, total)}{Grand \,\, total} \]
- Compute the Chi-Square Statistic: Use the chi-square formula to calculate the test statistic.
- Determine the Degrees of Freedom (df): For the test of independence, df is calculated as: \[ df = (r-1) \times (c-1) \] where r is the number of rows and c is the number of columns.
- Find the Critical Value: Use a chi-square distribution table or statistical software to find the critical value based on the significance level (α) and the degrees of freedom.
- Compare the Test Statistic to the Critical Value: If the test statistic is greater than the critical value, reject the null hypothesis; otherwise, do not reject it.
Interpreting the Results
If the chi-square statistic is greater than the critical value, it indicates that there is a significant association between the variables, suggesting that the observed frequencies are significantly different from the expected frequencies under the null hypothesis. Conversely, if the chi-square statistic is less than the critical value, there is no significant association between the variables.
Chi-square tests are widely used in research fields such as marketing, psychology, and social sciences to analyze survey data and experimental results involving categorical variables.
Chi-Square Test Formula
The chi-square test is a statistical method used to determine if there is a significant difference between the expected frequencies and the observed frequencies in one or more categories. The formula for the chi-square test is:
Where:
- χ2 is the chi-square statistic.
- O represents the observed frequency.
- E represents the expected frequency.
- ∑ denotes the sum of the calculations for each category.
Steps to Calculate Chi-Square Statistic
- State the null hypothesis (H0) and the alternative hypothesis (HA). Typically, the null hypothesis states that there is no significant difference between the observed and expected frequencies.
- Calculate the expected frequencies for each category. The expected frequency for a category is calculated as:
- Compute the chi-square statistic using the formula provided above. For each category, subtract the expected frequency from the observed frequency, square the result, and then divide by the expected frequency. Sum these values to get the chi-square statistic.
- Determine the degrees of freedom (df) for the test. For a chi-square test, the degrees of freedom are calculated as:
- Compare the calculated chi-square statistic to the critical value from the chi-square distribution table with the appropriate degrees of freedom and significance level (commonly 0.05). If the calculated statistic exceeds the critical value, reject the null hypothesis.
Example Problem
Suppose we want to test if there is an association between gender (male, female) and political party preference (Republican, Democrat, Independent) in a sample of 440 voters. The observed frequencies are:
| Republican | Democrat | Independent | Total | |
|---|---|---|---|---|
| Male | 100 | 70 | 30 | 200 |
| Female | 140 | 60 | 20 | 220 |
| Total | 240 | 130 | 50 | 440 |
To calculate the expected frequency for each cell, use the formula for expected frequency. For example, for males who prefer Republican:
Perform similar calculations for the other cells, compute the chi-square statistic, and compare it to the critical value to determine if there is a significant association between gender and political party preference.
Chi-Square Goodness of Fit Test
The Chi-Square Goodness of Fit Test is a statistical method used to determine if a sample data set matches an expected distribution. This test is particularly useful for categorical data and helps to verify whether the observed frequencies differ significantly from the expected frequencies.
Here are the detailed steps involved in performing a Chi-Square Goodness of Fit Test:
- Definition and Purpose:
The test checks if a variable from a sample follows a hypothesized distribution. It helps in understanding if the sample data fits well with the expected pattern.
- Hypotheses Formulation:
Set up the null and alternative hypotheses. For example:
- \( H_0 \): The data follows the expected distribution.
- \( H_a \): The data does not follow the expected distribution.
- Calculating Expected Frequencies:
Determine the expected frequency for each category based on the total number of observations and the hypothesized distribution. For instance, if you expect an equal distribution across 5 categories, the expected frequency for each category is \( \frac{\text{Total Observations}}{5} \).
- Calculating the Test Statistic:
The Chi-Square test statistic is calculated using the formula:
\[ \chi^2 = \sum \frac{(O_i - E_i)^2}{E_i} \]
where \( O_i \) is the observed frequency for category \( i \), and \( E_i \) is the expected frequency for category \( i \).
- Finding the Critical Value:
Determine the degrees of freedom, which is the number of categories minus one. Using the degrees of freedom and the chosen significance level (e.g., 0.05), find the critical value from the Chi-Square distribution table.
- Interpreting Results:
Compare the calculated Chi-Square statistic to the critical value:
- If the Chi-Square statistic is greater than the critical value, reject the null hypothesis (\( H_0 \)).
- If the Chi-Square statistic is less than or equal to the critical value, fail to reject the null hypothesis (\( H_0 \)).
- Example Problems:
Consider a shop owner who claims that an equal number of customers visit each day of the week. An independent researcher records the actual number of customers for each day and performs a Chi-Square Goodness of Fit Test to verify this claim.
For instance, if the observed frequencies are:
- Monday: 50
- Tuesday: 60
- Wednesday: 40
- Thursday: 47
- Friday: 53
The expected frequency for each day (assuming an equal distribution) is 50. The Chi-Square statistic is calculated as:
\[ \chi^2 = \frac{(50-50)^2}{50} + \frac{(60-50)^2}{50} + \frac{(40-50)^2}{50} + \frac{(47-50)^2}{50} + \frac{(53-50)^2}{50} = 4.36 \]
Using the degrees of freedom (4) and the chosen significance level, you can find the critical value and compare it with the calculated statistic to draw a conclusion.
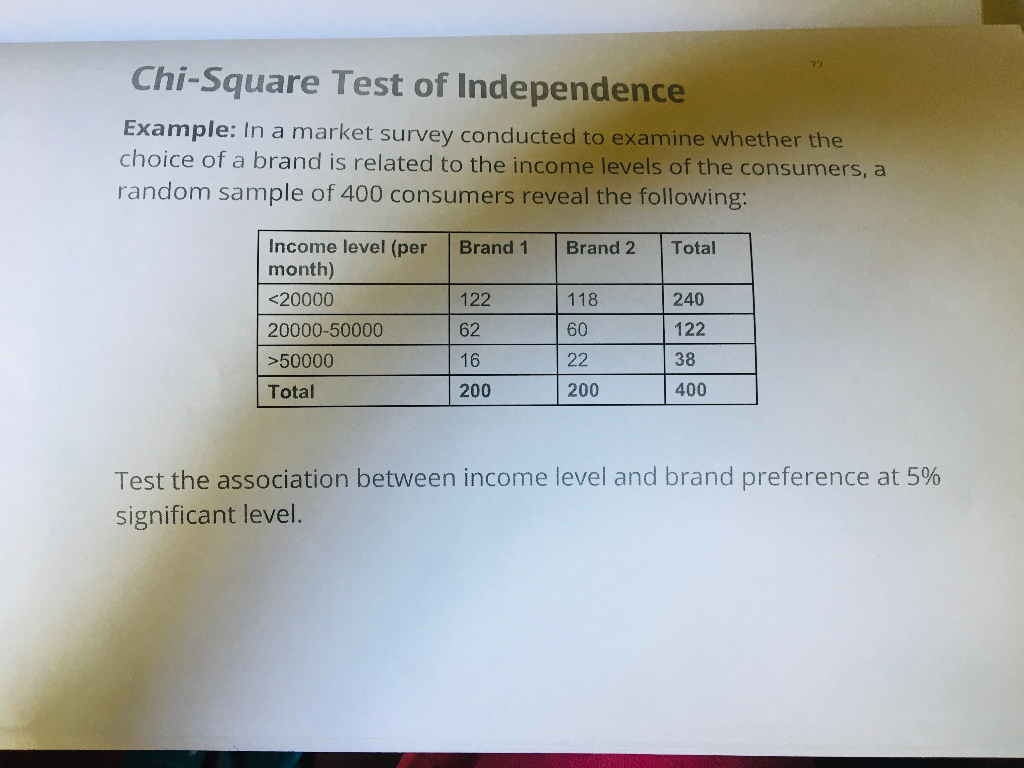
Chi-Square Test of Independence
The Chi-Square Test of Independence is used to determine if there is a significant association between two categorical variables. This test helps us understand whether the distribution of one variable differs depending on the category of the other variable.
To conduct a Chi-Square Test of Independence, follow these steps:
- State the Hypotheses:
- Null Hypothesis (\(H_0\)): The two categorical variables are independent.
- Alternative Hypothesis (\(H_1\)): The two categorical variables are dependent.
- Construct the Contingency Table:
Create a contingency table to display the frequency distribution of the variables. For example:
Category 1 Category 2 Total Variable A Observed A1 Observed A2 Row Total A Variable B Observed B1 Observed B2 Row Total B Total Column Total 1 Column Total 2 Grand Total - Calculate Expected Frequencies:
The expected frequency for each cell in the contingency table is calculated using the formula:
\[ E_{ij} = \frac{(\text{Row Total} \times \text{Column Total})}{\text{Grand Total}} \]
For example, if the row total for Variable A and the column total for Category 1 are both 100, and the grand total is 200, the expected frequency \(E_{11}\) would be:
\[ E_{11} = \frac{(100 \times 100)}{200} = 50 \]
- Compute the Chi-Square Statistic:
The test statistic is calculated using the formula:
\[ \chi^2 = \sum \frac{(O_{ij} - E_{ij})^2}{E_{ij}} \]
Where \(O_{ij}\) is the observed frequency and \(E_{ij}\) is the expected frequency. For example, if the observed frequency is 60 and the expected frequency is 50, the contribution to the Chi-Square statistic for that cell is:
\[ \frac{(60 - 50)^2}{50} = 2 \]
- Determine the Degrees of Freedom:
The degrees of freedom for the test are calculated as:
\[ \text{Degrees of Freedom} = (r - 1) \times (c - 1) \]
Where \(r\) is the number of rows and \(c\) is the number of columns in the contingency table.
- Find the Critical Value and P-Value:
Using a Chi-Square distribution table or software, find the critical value and p-value corresponding to the calculated Chi-Square statistic and the degrees of freedom.
- Make a Decision:
Compare the p-value to the significance level (usually 0.05). If the p-value is less than the significance level, reject the null hypothesis, indicating that there is a significant association between the two variables.
For example, suppose we want to test if gender is associated with political party preference using the following observed data:
| Republican | Democrat | Independent | Total | |
|---|---|---|---|---|
| Male | 120 | 90 | 40 | 250 |
| Female | 110 | 95 | 45 | 250 |
| Total | 230 | 185 | 85 | 500 |
After calculating the expected frequencies and the test statistic, if the p-value is less than 0.05, we reject the null hypothesis and conclude that there is a significant association between gender and political party preference.
Real-Life Applications
Chi-square tests have a wide range of applications in various fields. These tests help determine if there is a significant association between categorical variables. Below are some examples of real-life applications of chi-square tests:
- Gender and Education Level
A study might investigate whether there is a significant relationship between gender and the highest level of education achieved. By collecting data on individuals' genders and their education levels, a chi-square test of independence can be used to determine if education level distribution is independent of gender.
- Political Party Preference
Political analysts often use chi-square tests to explore the relationship between demographic variables and political party preference. For example, they might test if age groups have different political party preferences. By setting up a contingency table with age groups and party preferences, the chi-square test can help reveal any significant associations.
- Marital Status and Education Level
Researchers may use a chi-square test to examine if marital status is related to education level. By categorizing data into marital status (e.g., single, married, divorced) and highest education achieved, the chi-square test of independence can indicate whether these variables are associated.
- Consumer Behavior
Marketing researchers often use chi-square tests to analyze consumer behavior. For instance, a company may want to know if there is a relationship between product choice and demographic factors like age or income. By creating a contingency table of product choices and demographic categories, the chi-square test can provide insights into consumer preferences.
- Healthcare Studies
In healthcare, chi-square tests are used to investigate the association between health conditions and lifestyle factors. For example, researchers might study whether smoking status is related to the incidence of lung cancer. By analyzing observed and expected frequencies in different categories, the chi-square test can help determine if there is a significant relationship.
These examples illustrate the versatility of chi-square tests in analyzing categorical data and uncovering significant relationships in various domains.
Additional Resources
To further your understanding and practice of chi-square tests, here are some valuable resources:
-
Chi-Square Test Calculators:
- Online tools to calculate chi-square test statistics and p-values efficiently.
- Useful for checking your manual calculations and ensuring accuracy.
-
Practice Problems:
- Websites offering a range of practice problems to enhance your skills.
- Step-by-step solutions provided to help you understand the problem-solving process.
-
FAQs:
- Common questions and detailed answers about chi-square tests.
- Helps clarify doubts and provides additional insights into complex concepts.
-
Video Tutorials:
- Visual explanations of chi-square tests, including examples and detailed walkthroughs.
- Helpful for visual learners who prefer interactive learning experiences.
-
Interactive Learning Platforms:
- Websites like Khan Academy that offer structured courses on chi-square tests.
- Includes quizzes and interactive exercises to reinforce learning.
These resources provide a comprehensive approach to mastering chi-square tests, from theoretical understanding to practical application.
Conclusion
The chi-square test is a crucial statistical tool used to analyze categorical data. It helps determine whether there is a significant association between two variables or if an observed distribution differs from an expected one. Through its applications in various fields—such as psychology, biology, and marketing—chi-square tests facilitate informed decision-making based on empirical data.
In this guide, we've explored the fundamental aspects of chi-square tests, including:
- Chi-Square Goodness of Fit Test: Assessing how well an observed distribution matches an expected distribution.
- Chi-Square Test of Independence: Evaluating the association between two categorical variables in a contingency table.
We have also provided real-life examples and step-by-step procedures to calculate chi-square values, interpret results, and make conclusions. These examples underscore the practical importance of chi-square tests in research and everyday decision-making.
To further aid your understanding and application of chi-square tests, consider using online chi-square calculators, engaging in practice problems, and consulting additional resources and FAQs. As you continue to explore statistical analysis, remember that mastering chi-square tests will enhance your ability to analyze data accurately and draw meaningful conclusions.
By harnessing the power of chi-square tests, you can contribute to data-driven insights and solutions in various fields, from social sciences to market research. Keep learning, practicing, and applying these statistical methods to become proficient in interpreting and utilizing data effectively.

Hướng dẫn chi tiết cách thực hiện kiểm định chi-square bằng tay, phù hợp cho những ai muốn hiểu rõ hơn về phương pháp này và cách áp dụng nó.
Cách Thực Hiện Kiểm Định Chi-Square (Bằng Tay)
READ MORE:
Video hướng dẫn chi tiết về kiểm định chi-square để xác định sự độc lập giữa hai biến, phù hợp cho những ai muốn hiểu rõ hơn về phương pháp này và cách áp dụng nó.
Kiểm Định Chi-Square Độc Lập
:max_bytes(150000):strip_icc()/Chi-SquareStatistic_Final_4199464-7eebcd71a4bf4d9ca1a88d278845e674.jpg)