Topic examples on chi square test: The chi-square test is a statistical tool used to analyze categorical data by comparing observed and expected frequencies. It helps determine if there are significant differences or associations between variables, making it essential for research in various fields. Explore the different types, assumptions, and applications of chi-square tests in this comprehensive guide.
Table of Content
- Chi-Square Test Examples
- Introduction to Chi-Square Tests
- Types of Chi-Square Tests
- Assumptions of Chi-Square Tests
- Steps to Perform Chi-Square Test
- Examples of Chi-Square Test Applications
- Interpreting Chi-Square Test Results
- Common Misconceptions and Errors
- YOUTUBE: Tìm hiểu về các ví dụ về kiểm định Chi-Square trong video này, bao gồm các bước thực hiện và ý nghĩa của kết quả.
Chi-Square Test Examples
The Chi-Square test is a statistical method used to determine if there is a significant association between categorical variables. Here, we will explore examples of both the Chi-Square Test of Independence and the Chi-Square Goodness of Fit Test.
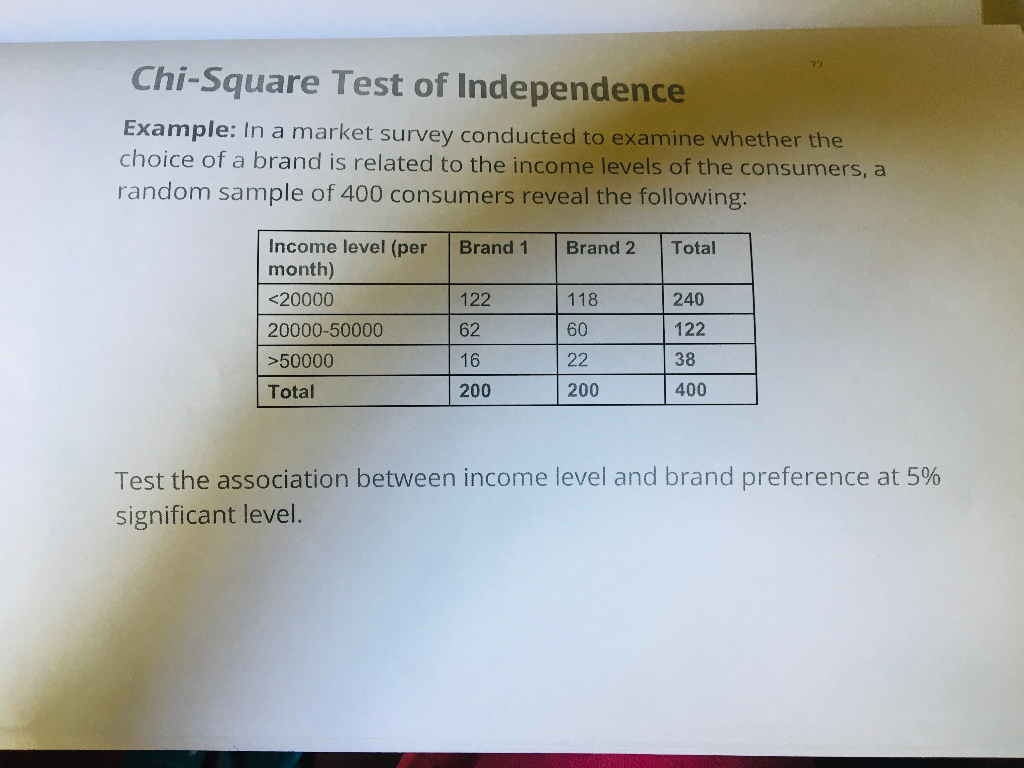
Chi-Square Test of Independence
This test assesses whether two categorical variables are independent. It is commonly used in hypothesis testing to determine if observed frequencies differ from expected frequencies under the null hypothesis that the variables are independent.
Example: Pet Ownership and Preference for Organic Pet Food
Consider the following data on pet ownership and preference for organic vs. non-organic pet food:
| Prefers Organic Pet Food | Prefers Non-Organic Pet Food | Total | |
|---|---|---|---|
| Owns a Pet | 120 | 80 | 200 |
| Does Not Own a Pet | 60 | 140 | 200 |
| Total | 180 | 220 | 400 |
We can calculate the expected frequencies using the formula:
\[\text{Expected Frequency} = \frac{(\text{Row Total} \times \text{Column Total})}{\text{Grand Total}}\]
The Chi-Square statistic is then calculated as:
\[\chi^2 = \sum \frac{(O - E)^2}{E}\]
Where \(O\) is the observed frequency and \(E\) is the expected frequency.
Chi-Square Goodness of Fit Test
This test determines if a sample matches the expected distribution of a population. It compares the observed frequencies with the expected frequencies to test the null hypothesis that the sample distribution fits the population distribution.
Example: Coin Toss
Suppose you toss a coin 100 times, expecting 50 heads and 50 tails. The observed results are 55 heads and 45 tails. We can use the Chi-Square Goodness of Fit Test to determine if the coin is fair:
The expected frequency for heads and tails is 50 each. The Chi-Square statistic is calculated as:
\[\chi^2 = \sum \frac{(O - E)^2}{E}\]
For heads: \[\frac{(55 - 50)^2}{50} = \frac{25}{50} = 0.5\]
For tails: \[\frac{(45 - 50)^2}{50} = \frac{25}{50} = 0.5\]
The Chi-Square statistic is \(\chi^2 = 0.5 + 0.5 = 1.0\).
Conclusion
By comparing the calculated Chi-Square statistic to the critical value from the Chi-Square distribution table, we can determine if we should reject the null hypothesis. If the Chi-Square statistic is greater than the critical value, we reject the null hypothesis, indicating a significant difference between the observed and expected frequencies.
:max_bytes(150000):strip_icc()/Chi-SquareStatistic_Final_4199464-7eebcd71a4bf4d9ca1a88d278845e674.jpg)
READ MORE:
Introduction to Chi-Square Tests
The Chi-Square test is a statistical method used to determine if there is a significant association between categorical variables. This test is widely utilized in various fields such as social sciences, biology, and marketing to analyze frequencies and assess relationships.
There are two primary types of Chi-Square tests:
- Chi-Square Goodness of Fit Test: This test determines if a sample data matches a population with a specific distribution. It is used when you have one categorical variable from a single population. The test compares the observed frequencies with the expected frequencies derived from the hypothesized distribution.
- Chi-Square Test of Independence: This test assesses whether two categorical variables are independent of each other. It involves data in a contingency table format and examines whether the distribution of sample categorical data matches an expected distribution if the variables are indeed independent.
To perform a Chi-Square test, the following assumptions must be met:
- All expected frequencies should be at least 1, and no more than 20% of expected frequencies are less than 5.
- Observations must be independent of each other, which is typically achieved through random sampling.
- Both variables should be categorical (nominal or ordinal).
The test statistic for the Chi-Square test is calculated using the formula:
\[
\chi^2 = \sum \frac{{(O_i - E_i)^2}}{E_i}
\]
where \( O_i \) is the observed frequency and \( E_i \) is the expected frequency. The resulting Chi-Square statistic is then compared to a critical value from the Chi-Square distribution table to determine if the null hypothesis can be rejected.
The Chi-Square test provides valuable insights into categorical data and helps researchers understand the relationships between variables, making it an essential tool in statistical analysis.
Types of Chi-Square Tests
The Chi-Square Test is a statistical method used to determine if there is a significant association between categorical variables. There are two primary types of Chi-Square Tests:
- Chi-Square Goodness of Fit Test: This test determines if the observed frequencies of a single categorical variable match the expected frequencies. It helps to assess whether a sample data matches a population with a specific distribution.
- Chi-Square Test of Independence: This test assesses whether there is a significant association between two categorical variables. It evaluates if the distribution of one variable differs depending on the category of the second variable.
Both tests compare observed values with expected values based on the null hypothesis, and the results help in decision-making regarding the hypotheses.
Assumptions of Chi-Square Tests
When conducting a chi-square test, it is crucial to meet several assumptions to ensure valid results. Here are the main assumptions:
- Sample Size: The sample size should be sufficiently large. Typically, each expected frequency should be at least 5.
- Independence: Observations must be independent of each other. The occurrence of one event should not influence the occurrence of another.
- Categorical Data: The data should be in the form of counts of categorical variables, not continuous data.
- Expected Frequencies: The expected frequency for each cell in the contingency table should be at least 1, and preferably at least 5.
Failing to meet these assumptions can lead to inaccurate results, so it's important to check these conditions before performing a chi-square test.
Steps to Perform Chi-Square Test
The Chi-Square test is a statistical method used to determine if there's a significant association between categorical variables. Here are the steps to perform a Chi-Square test:
- Define Null and Alternative Hypotheses
- Null Hypothesis (H0): Assumes no association between the variables.
- Alternative Hypothesis (H1): Assumes there is an association between the variables.
- Calculate Expected Frequencies
Use the formula:
\[
\text{Expected\ Frequency} = \frac{\left(\text{Row\ Total}\right) \times \left(\text{Column\ Total}\right)}{\text{Total\ Number\ of\ Observations}}
\] - Compute Chi-Square Statistic
Calculate using:
\[
\chi^2 = \sum \frac{(O_i - E_i)^2}{E_i}
\]- \(O_i\): Observed frequency
- \(E_i\): Expected frequency
- Determine Degrees of Freedom
Calculate as:
\[
\text{Degrees\ of\ Freedom} = (r-1) \times (c-1)
\]- \(r\): Number of rows
- \(c\): Number of columns
- Compare Chi-Square Value with Critical Value
Using the Chi-Square distribution table, find the critical value for the given degrees of freedom and significance level (commonly 0.05).
- Make Decision to Reject or Not Reject Null Hypothesis
If the Chi-Square statistic is greater than the critical value, reject the null hypothesis, indicating a significant association between the variables. Otherwise, do not reject the null hypothesis.

Examples of Chi-Square Test Applications
Chi-square tests have a wide range of applications in various fields. Here are some examples that illustrate how chi-square tests can be used to analyze categorical data:
-
Testing Distribution of Bird Species:
Researchers might use a chi-square goodness of fit test to determine if the observed distribution of different bird species in a nature reserve matches the expected distribution based on historical data.
-
Analyzing Handedness and Nationality:
A chi-square test of independence can be used to assess whether there is a significant association between handedness (left-handed or right-handed) and nationality among a sample of people.
-
Pet Ownership and Preference for Organic Food:
Using a chi-square test of independence, one can investigate if there is a relationship between pet ownership and preference for organic pet food. For example, the data might show how many pet owners prefer organic food versus non-organic food.
Prefers Organic Pet Food Prefers Non-Organic Pet Food Total Owns a Pet 120 80 200 Does Not Own a Pet 60 140 200 Total 180 220 400 -
Student Gender and Course Selection:
Educational researchers might apply a chi-square test of independence to examine if there is a significant relationship between student gender and the selection of academic courses.
Interpreting Chi-Square Test Results
Interpreting the results of a Chi-Square test involves understanding key components such as significance levels, p-values, and degrees of freedom. These elements help determine whether to reject the null hypothesis.
- Significance Levels and P-Values:
The p-value indicates the probability that the observed data would occur by random chance if the null hypothesis is true. A common significance level used is 0.05. If the p-value is less than the significance level, you reject the null hypothesis.
- Critical Value Comparison:
Compare the Chi-Square statistic to the critical value from the Chi-Square distribution table. The critical value depends on the significance level and the degrees of freedom. If the Chi-Square statistic is greater than the critical value, reject the null hypothesis.
- Understanding Degrees of Freedom:
Degrees of freedom for a Chi-Square test are calculated based on the number of categories minus one. For example, in a test with two variables, the degrees of freedom would be (number of rows - 1) * (number of columns - 1).
To illustrate, consider a Chi-Square test of independence to determine if there is a relationship between gender and political party preference. If the calculated Chi-Square statistic exceeds the critical value at a 0.05 significance level, you conclude that there is a significant association between gender and political party preference.
Common Misconceptions and Errors
The Chi-Square test is a robust statistical tool, but there are common misconceptions and errors that can lead to incorrect conclusions. Understanding and avoiding these pitfalls ensures the reliability of your test results.
-
Small Sample Sizes:
The Chi-Square test requires a sufficiently large sample size to be valid. A common misconception is that it can be used with small sample sizes. When the sample size is too small, the test can yield inaccurate results due to the instability of the Chi-Square distribution. Typically, each expected frequency should be at least 5.
-
Dependent Observations:
Another common error is assuming that Chi-Square tests can be used with dependent observations. The test assumes that the data points are independent of each other. Violating this assumption can lead to misleading results. For example, in a survey, if participants influence each other’s responses, the observations are not independent.
-
Incorrectly Categorized Data:
Chi-Square tests are designed for categorical data, and using them on continuous data that has been artificially categorized can lead to errors. It is important to ensure that the data is truly categorical and that the categories are mutually exclusive and exhaustive. Improper categorization can distort the test results.
-
Ignoring Assumptions:
Many users ignore the assumptions underlying the Chi-Square test, such as the requirement for a random sample and the appropriate calculation of expected frequencies. Failing to meet these assumptions can invalidate the test results.
-
Misinterpreting the P-Value:
A common error is misinterpreting the P-value. A P-value less than the significance level (e.g., 0.05) indicates that the observed data significantly deviates from the null hypothesis, but it does not measure the size or importance of this deviation. Similarly, a high P-value does not prove the null hypothesis; it merely indicates insufficient evidence to reject it.
Tìm hiểu về các ví dụ về kiểm định Chi-Square trong video này, bao gồm các bước thực hiện và ý nghĩa của kết quả.
Ví Dụ Về Kiểm Định Chi-Square
READ MORE:
Hướng dẫn chi tiết cách thực hiện kiểm định Chi-Square bằng tay, từng bước cụ thể giúp bạn hiểu rõ quy trình và ứng dụng của kiểm định này.
Cách Thực Hiện Kiểm Định Chi-Square (Bằng Tay)