Topic explain chi square test: The Chi Square Test is a fundamental statistical tool used to determine if there is a significant association between two categorical variables. This comprehensive guide explains the test's purpose, how to perform it, and its applications in various fields, making it accessible for both beginners and advanced users.
Table of Content
- Chi-Square Test of Independence
- Chi-Square Goodness of Fit Test
- Chi-Square Goodness of Fit Test
- Introduction to Chi-Square Test
- Types of Chi-Square Tests
- Chi-Square Distribution
- Formulas and Calculations
- Steps to Perform Chi-Square Test
- Applications of Chi-Square Test
- When to Use Chi-Square Test
- Properties of Chi-Square Test
- Limitations of Chi-Square Test
- Conclusion
- YOUTUBE: Xem video để hiểu Chi-Square Test một cách dễ hiểu nhất và xem liệu nó có phù hợp với bài viết giải thích về Chi-Square Test hay không.
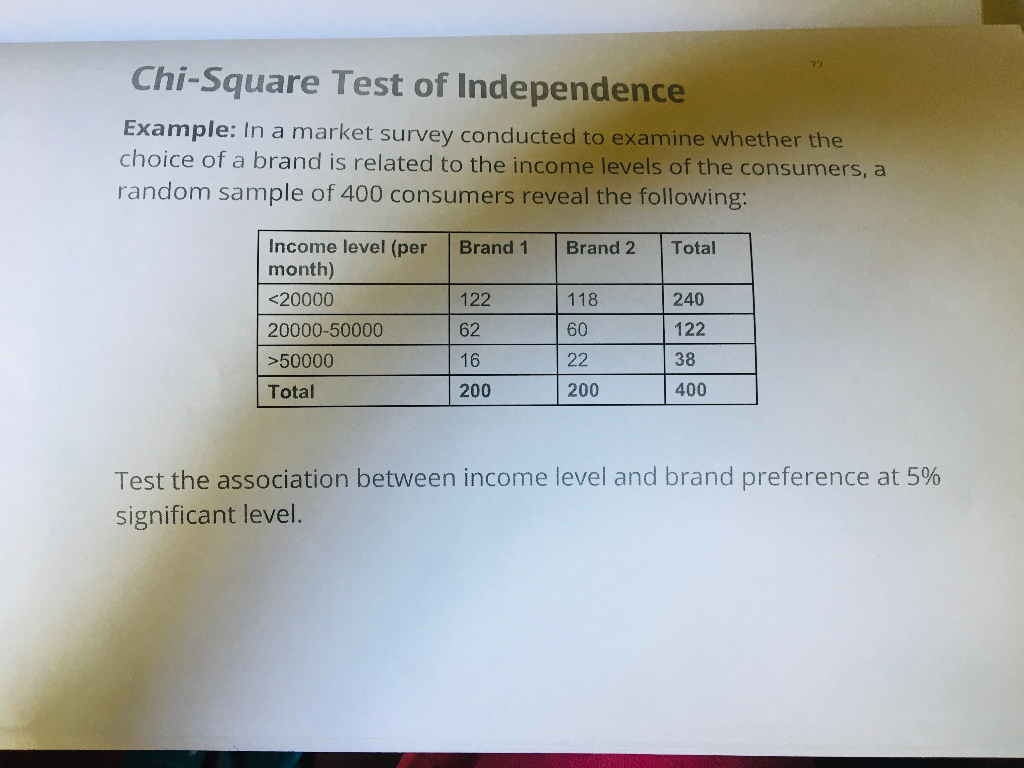
Chi-Square Test of Independence
This test is used to examine if there is a significant association between two categorical variables. The steps to perform this test are as follows:
- Define the null hypothesis (H0): The two variables are independent.
- Define the alternative hypothesis (H1): The two variables are not independent.
- Calculate the expected frequencies using the formula:
- Compute the Chi-Square statistic:
Where O is the observed frequency and E is the expected frequency. - Find the critical value from the Chi-Square distribution table, considering the degrees of freedom (df):
- Compare the computed Chi-Square statistic to the critical value to decide whether to reject the null hypothesis.
Example
Suppose we want to determine if there is an association between gender and political party preference. The observed data is:
| Gender | Republican | Democrat | Independent | Total |
|---|---|---|---|---|
| Male | 120 | 90 | 40 | 250 |
| Female | 110 | 95 | 45 | 250 |
| Total | 230 | 185 | 85 | 500 |
Expected values are calculated as:
| Gender | Republican | Democrat | Independent |
|---|---|---|---|
| Male | 115 | 92.5 | 42.5 |
| Female | 115 | 92.5 | 42.5 |
The Chi-Square statistic is calculated as:
The degrees of freedom (df) is:
Using the Chi-Square distribution table, we compare the test statistic to the critical value for df = 2. If the p-value is less than the chosen significance level (e.g., 0.05), we reject the null hypothesis. In this example, since the p-value is greater than 0.05, we fail to reject the null hypothesis, indicating no significant association between gender and political party preference.
:max_bytes(150000):strip_icc()/Chi-SquareStatistic_Final_4199464-7eebcd71a4bf4d9ca1a88d278845e674.jpg)
READ MORE:
Chi-Square Goodness of Fit Test
This test is used to determine if a sample data matches a population with a specific distribution. Steps for this test include:
- Define the null hypothesis (H0): The sample data fits the specified distribution.
- Define the alternative hypothesis (H1): The sample data does not fit the specified distribution.
- Calculate the expected frequencies for each category.
- Compute the Chi-Square statistic:
- Determine the degrees of freedom (df):
- Compare the Chi-Square statistic to the critical value to decide whether to reject the null hypothesis.
Introduction to Chi-Square Test
The Chi-Square Test is a statistical method used to determine if there is a significant difference between the expected and observed frequencies in categorical data. It is commonly applied in hypothesis testing to assess whether distributions of categorical variables differ from one another.
There are two main types of Chi-Square Tests:
- Chi-Square Goodness of Fit Test: This test determines if a sample data matches a population with a specific distribution.
- Chi-Square Test of Independence: This test checks if there is a significant association between two categorical variables.
The Chi-Square statistic is calculated using the formula:
\[
\chi^2 = \sum \frac{(O_i - E_i)^2}{E_i}
\]
where \( O_i \) represents the observed frequency and \( E_i \) represents the expected frequency.
To perform a Chi-Square Test, follow these steps:
- Define the null and alternative hypotheses.
- Determine the significance level (alpha).
- Collect and organize the data into a contingency table.
- Calculate the expected frequencies for each category.
- Compute the Chi-Square statistic using the formula above.
- Compare the computed statistic to the critical value from the Chi-Square distribution table.
- Draw a conclusion based on the comparison.
The Chi-Square Test is widely used in various fields such as market research, genetics, and social sciences to test hypotheses about the relationships between categorical variables.
Types of Chi-Square Tests
The Chi-Square test is a statistical method used to determine if there is a significant association between categorical variables. There are several types of Chi-Square tests, each serving different purposes. Below are the primary types:
-
Chi-Square Test of Independence
This test determines whether two categorical variables are independent of each other. It is commonly used in contingency table analysis. For example, it can assess if there is an association between gender and voting preference.
- Construct a contingency table with observed frequencies.
- Calculate the expected frequencies for each cell in the table using the formula:
\[ E = \frac{( \text{Row total} \times \text{Column total})}{\text{Grand total}} \] - Compute the Chi-Square statistic using:
\[ \chi^2 = \sum \frac{(O - E)^2}{E} \] - Compare the calculated Chi-Square value to the critical value from the Chi-Square distribution table to determine significance.
-
Chi-Square Goodness of Fit Test
This test evaluates whether the observed frequency distribution of a categorical variable matches an expected distribution. It is used when you want to see if your sample data fits a population with a specific distribution.
- Specify the expected frequencies for each category.
- Calculate the observed frequencies from your sample data.
- Use the Chi-Square formula to calculate the test statistic:
\[ \chi^2 = \sum \frac{(O - E)^2}{E} \] - Compare the calculated Chi-Square value to the critical value from the Chi-Square distribution table.
-
Chi-Square Test for Homogeneity
This test determines if different samples come from the same population or if they have the same distribution of a categorical variable. It is similar to the test of independence but is used when you have two or more independent samples.
- Construct a contingency table with observed frequencies from different samples.
- Calculate the expected frequencies for each cell.
- Compute the Chi-Square statistic:
\[ \chi^2 = \sum \frac{(O - E)^2}{E} \] - Compare the calculated value to the critical value to assess homogeneity.
These Chi-Square tests are widely used in research for hypothesis testing, helping to determine the relationships between categorical variables and the fit of observed data to theoretical distributions.

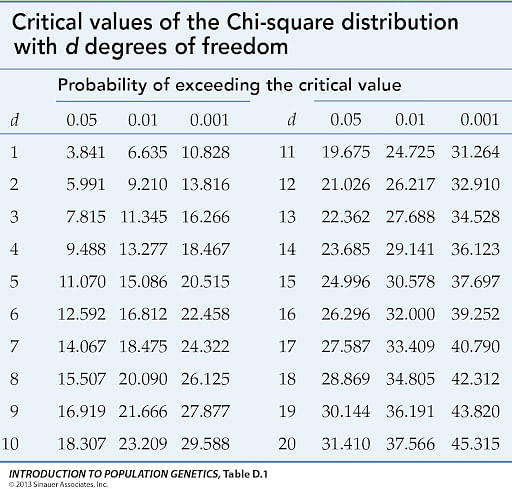
Chi-Square Distribution
The chi-square distribution is a theoretical distribution that describes the distribution of the sum of squared deviations of a random sample drawn from a normal population. It is used in hypothesis testing and in constructing confidence intervals for variance when the underlying distribution is normal.
The chi-square distribution has the following properties:
- The distribution is skewed to the right, especially for low degrees of freedom.
- As the degrees of freedom increase, the distribution approaches a normal distribution.
- The mean of the distribution is equal to the degrees of freedom.
- The variance is equal to twice the degrees of freedom.
The formula for the chi-square statistic is given by:
\[
X^2 = \sum \frac{(O_i - E_i)^2}{E_i}
\]
Where \( O_i \) represents the observed frequency and \( E_i \) represents the expected frequency. The chi-square distribution is utilized in two main types of chi-square tests:
- Chi-Square Test of Independence: This test assesses whether two categorical variables are independent.
- Chi-Square Goodness of Fit Test: This test determines if a sample data matches a population with a specific distribution.
In practical applications, the chi-square distribution is used to compare the goodness of fit of an observed distribution to a theoretical one, and to test the independence of two variables in a contingency table.
To perform a chi-square test, follow these steps:
- State the null and alternative hypotheses.
- Calculate the expected frequencies for each category.
- Compute the chi-square statistic using the observed and expected frequencies.
- Determine the degrees of freedom and find the critical value from the chi-square distribution table.
- Compare the calculated chi-square statistic to the critical value to decide whether to reject the null hypothesis.
Formulas and Calculations
The Chi-Square test is a statistical method to determine if there is a significant association between two categorical variables. The test statistic for the Chi-Square test is calculated using the observed and expected frequencies. Here are the steps and formulas used in the Chi-Square test calculations:
-
Calculate the expected frequency for each category using the formula:
\[
E = \frac{(\text{row total}) \times (\text{column total})}{\text{grand total}}
\] -
Compute the Chi-Square statistic using the formula:
\[
\chi^2 = \sum \frac{(O - E)^2}{E}
\]Where:
- \(O\) = Observed frequency
- \(E\) = Expected frequency
-
Calculate the degrees of freedom (\(df\)) using the formula:
\[
df = (r - 1) \times (c - 1)
\]Where:
- \(r\) = Number of rows
- \(c\) = Number of columns
-
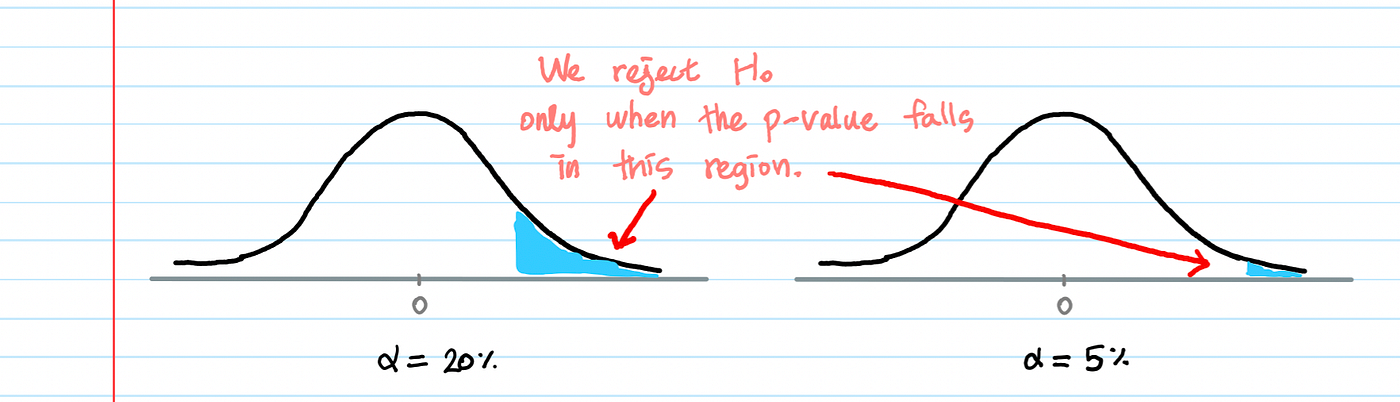
Determine the p-value associated with the computed Chi-Square statistic and the degrees of freedom.
If the p-value is less than the chosen significance level (e.g., 0.05), reject the null hypothesis.
Let’s illustrate these steps with an example:
| Category 1 | Category 2 | Total | |
| Group A | 50 | 30 | 80 |
| Group B | 20 | 40 | 60 |
| Total | 70 | 70 | 140 |
Step 1: Calculate the expected frequency for each cell:
\[
E_{A1} = \frac{(80 \times 70)}{140} = 40
\]
\[
E_{A2} = \frac{(80 \times 70)}{140} = 40
\]
\[
E_{B1} = \frac{(60 \times 70)}{140} = 30
\]
\[
E_{B2} = \frac{(60 \times 70)}{140} = 30
\]
Step 2: Compute the Chi-Square statistic:
\[
\chi^2 = \frac{(50-40)^2}{40} + \frac{(30-40)^2}{40} + \frac{(20-30)^2}{30} + \frac{(40-30)^2}{30} = 5
\]
Step 3: Calculate the degrees of freedom:
\[
df = (2-1) \times (2-1) = 1
\]
Step 4: Determine the p-value from the Chi-Square distribution table using the Chi-Square statistic and the degrees of freedom. If the p-value is less than the chosen significance level (e.g., 0.05), reject the null hypothesis.
Steps to Perform Chi-Square Test
The Chi-Square test is a statistical method used to determine if there is a significant association between categorical variables. Below are the detailed steps to perform a Chi-Square test:
-
Define the Hypotheses:
Formulate the null hypothesis (\(H_0\)) and the alternative hypothesis (\(H_a\)). The null hypothesis typically states that there is no association between the variables, while the alternative hypothesis suggests that there is an association.
-
Collect the Data:
Gather the observed data and organize it into a contingency table. The table should display the frequency of occurrences for each category combination of the variables.
-
Calculate the Expected Frequencies:
Use the formula to calculate the expected frequency for each cell in the contingency table:
\[
E = \frac{( \text{Row Total} \times \text{Column Total})}{ \text{Grand Total}}
\] -
Compute the Chi-Square Statistic:
Calculate the Chi-Square statistic (\( \chi^2 \)) using the formula:
\[
\chi^2 = \sum \frac{(O - E)^2}{E}
\]where \( O \) is the observed frequency and \( E \) is the expected frequency.
-
Determine the Degrees of Freedom:
Calculate the degrees of freedom (df) for the test. For a contingency table, the degrees of freedom are calculated as:
\[
\text{df} = ( \text{Number of Rows} - 1) \times ( \text{Number of Columns} - 1)
\] -
Find the Critical Value:
Refer to the Chi-Square distribution table to find the critical value for the determined degrees of freedom and chosen significance level (usually 0.05).
-
Compare the Test Statistic to the Critical Value:
Compare the computed \( \chi^2 \) value to the critical value from the Chi-Square distribution table.
-
Make a Decision:
- If the \( \chi^2 \) value is greater than the critical value, reject the null hypothesis (\(H_0\)). This indicates a significant association between the variables.
- If the \( \chi^2 \) value is less than or equal to the critical value, fail to reject the null hypothesis. This suggests that there is no significant association between the variables.
Applications of Chi-Square Test
The Chi-Square Test is widely used in various fields to analyze categorical data. Below are some common applications:
- Market Research: To determine if consumer preferences are independent of demographic variables like age, gender, or income.
- Healthcare: To test if the distribution of a particular disease is independent of factors like geographical location or lifestyle habits.
- Education: To analyze if there is a relationship between students' performance and different teaching methods or study environments.
- Genetics: To assess whether the observed frequency of different genetic traits fits the expected distribution based on Mendelian inheritance.
- Manufacturing: To check if the defect rates in products are independent of different production batches or machines.
- Social Sciences: To investigate if social phenomena, such as voting behavior, are independent of socioeconomic factors.
Overall, the Chi-Square Test is a versatile statistical tool used to test hypotheses about the independence or goodness of fit of categorical data in various domains.
When to Use Chi-Square Test
The Chi-Square test is a statistical method used to determine if there is a significant association between categorical variables. It is appropriate to use the Chi-Square test in the following scenarios:
- Testing Independence: When you want to assess whether there is an association between two categorical variables. For example, to determine if there is a relationship between gender and voting preference.
- Comparing Observed vs. Expected Frequencies: When you need to compare observed frequencies of categorical data with expected frequencies to assess goodness of fit. This is applicable in scenarios like examining whether genetic data follows expected ratios.
- Frequency Distribution: When analyzing data that can be categorized into groups or bins, such as survey responses grouped by age ranges or income brackets.
- Homogeneity: When comparing the distribution of categorical data across different groups or populations to determine if they are homogeneous or not.
Overall, the Chi-Square test is robust for analyzing categorical data and is particularly useful when the assumptions of other statistical tests, like normality or homogeneity of variance, are not met.
Properties of Chi-Square Test
The Chi-Square test possesses several important properties that make it a valuable tool in statistical analysis:
- Non-parametric Test: Chi-Square is a non-parametric test, meaning it does not rely on assumptions about the distribution of the data. This makes it suitable for data that may not follow a normal distribution.
- Tests Independence: It tests the independence between categorical variables, assessing whether changes in one variable are related to changes in another.
- Flexibility: Chi-Square can be applied to various types of categorical data, including nominal and ordinal variables.
- Simple Calculation: The calculation of Chi-Square statistic and degrees of freedom is straightforward, involving basic arithmetic operations based on observed and expected frequencies.
- Wide Applicability: It is widely used across different fields such as biology, social sciences, business, and medicine to analyze survey data, experimental results, and more.
- Interpretation: Results from Chi-Square tests provide clear indications of statistical significance, aiding in decision-making and drawing conclusions based on categorical data.
Limitations of Chi-Square Test
Despite its utility, the Chi-Square test has several limitations that should be considered:
- Sample Size Sensitivity: Chi-Square test results can be sensitive to sample size, leading to inaccurate conclusions when dealing with small sample sizes or sparse data.
- Assumption of Independence: The test assumes that observations are independent of each other. Violations of this assumption can lead to biased results.
- Applicability to Categorical Data: Chi-Square is specifically designed for categorical data and may not be suitable for continuous or ordinal data without appropriate transformations.
- Validity of Expected Frequencies: Results can be unreliable if expected frequencies are not adequately estimated or if assumptions about the expected distribution are incorrect.
- Not Appropriate for Small Expected Frequencies: The Chi-Square test may not be valid when expected frequencies in any cell of the contingency table are less than 5, requiring alternative tests or adjustments.
- Interpretation of Results: While Chi-Square tests provide indications of statistical significance, they do not indicate the strength or direction of relationships between variables.
Conclusion
The Chi-Square test is a valuable statistical tool for analyzing categorical data and testing relationships between variables. By assessing whether observed frequencies differ significantly from expected frequencies, it helps researchers draw conclusions about the presence or absence of associations. Despite its limitations regarding sample size and assumptions of independence, Chi-Square remains widely used in various fields including social sciences, biology, and business. Understanding its properties and appropriate application can enhance the reliability of conclusions drawn from categorical data analysis.
Xem video để hiểu Chi-Square Test một cách dễ hiểu nhất và xem liệu nó có phù hợp với bài viết giải thích về Chi-Square Test hay không.
Phân tích Chi-Square [Được giải thích một cách đơn giản]
READ MORE:
Xem video để hiểu chi tiết về các bài kiểm định Chi-Square và xem liệu nó có phù hợp với bài viết giải thích về Chi-Square Test hay không.
Chi-Square Tests: Khóa học Tóm tắt Thống kê #29