Topic chi-square test solved examples: Discover the power of chi-square tests with our comprehensive guide, featuring solved examples that make mastering this statistical tool easier than ever. Learn how to perform chi-square tests for independence and goodness of fit, understand the formulas, and apply these methods to real-world scenarios. Start enhancing your data analysis skills today!
Table of Content
- Chi-Square Test Solved Examples
- Introduction
- Chi-Square Test Overview
- Types of Chi-Square Tests
- Chi-Square Formula
- Steps to Perform a Chi-Square Test
- Chi-Square Test Solved Examples
- Chi-Square Distribution
- Finding P-Values and Critical Values
- Chi-Square Test Applications
- Chi-Square Test FAQs
- YOUTUBE: Video này cung cấp hướng dẫn chi tiết về kiểm định Chi-Square và các ví dụ đã giải để giúp bạn hiểu rõ hơn về phương pháp này.
Chi-Square Test Solved Examples
The chi-square test is a statistical method used to determine if there is a significant association between two categorical variables. Below are some examples of how to solve chi-square tests.
Example 1: Chi-Square Goodness of Fit Test
Suppose a biologist claims that an equal number of four different species of deer enter a certain wooded area in a forest each week. To test this hypothesis, she records the number of each species of deer that enter the wooded area over the course of one week:
- Species #1: 22
- Species #2: 20
- Species #3: 23
- Species #4: 35
Using a chi-square goodness of fit test, she can determine if the distribution of deer species is consistent with her hypothesized distribution.
\[
\chi^2 = \sum \frac{(O - E)^2}{E}
\]
Example 2: Chi-Square Test of Independence
A policymaker wants to know if gender is associated with political party preference. A sample of 500 voters provides the following data:
| Republican | Democrat | Independent | Total | |
| Male | 120 | 90 | 40 | 250 |
| Female | 110 | 95 | 45 | 250 |
| Total | 230 | 185 | 85 | 500 |
Using a chi-square test of independence, the policymaker can test for an association between gender and political party preference.
\[
\chi^2 = \sum \frac{(O - E)^2}{E}
\]
Example 3: Another Chi-Square Test of Independence
A researcher wants to know if marital status is associated with education level. The sample data is as follows:
| High School | Bachelor’s | Master’s or Higher | Total | |
| Married | 20 | 100 | 35 | 155 |
| Single | 50 | 80 | 15 | 145 |
| Total | 70 | 180 | 50 | 300 |
The p-value obtained from the test can determine if there is a statistically significant association between marital status and education level.
Example 4: Chi-Square Test Statistic Calculation
Is gender independent of education level? A survey of 395 people resulted in the following observed and expected frequencies:
| High School | Bachelors | Masters | Ph.d. | Total | |
| Female (Observed) | 60 | 54 | 46 | 41 | 201 |
| Male (Observed) | 40 | 44 | 53 | 57 | 194 |
| Female (Expected) | 50.886 | 49.868 | 50.377 | 49.868 | 201 |
| Male (Expected) | 49.114 | 48.132 | 48.623 | 48.132 | 194 |
| Total | 100 | 98 | 99 | 98 | 395 |
The test statistic is calculated as follows:
\[
\chi^2 = \frac{(60 - 50.886)^2}{50.886} + \frac{(54 - 49.868)^2}{49.868} + \cdots + \frac{(57 - 48.132)^2}{48.132} = 8.006
\]
Since the calculated \(\chi^2\) value is greater than the critical value of 7.815 at 3 degrees of freedom, we reject the null hypothesis and conclude that education level depends on gender at a 5% significance level.
READ MORE:
Introduction
The chi-square test is a statistical method used to determine if there is a significant association between two categorical variables. This test is widely used in hypothesis testing to compare the observed frequencies in each category to the expected frequencies, which are calculated based on the assumption of no association between the variables. The chi-square test is versatile and can be applied in various fields such as social sciences, biology, and marketing to test hypotheses about relationships within categorical data.
The chi-square test statistic is calculated using the formula:
\[ \chi^2 = \sum \frac{(O - E)^2}{E} \]
where \( O \) represents the observed frequency and \( E \) represents the expected frequency. The sum is taken over all categories.
To perform a chi-square test, follow these steps:
- Calculate Expected Frequencies: Use the contingency table to calculate the expected frequencies for each category. The expected frequency for a cell in a contingency table is calculated as: \[ E = \frac{(\text{Row total} \times \text{Column total})}{\text{Grand total}} \]
- Compute the Chi-Square Statistic: Apply the chi-square formula to find the test statistic. This involves summing the squared differences between observed and expected frequencies, divided by the expected frequencies.
- Determine the Degrees of Freedom: The degrees of freedom (df) for a chi-square test of independence is calculated as: \[ df = (r - 1) \times (c - 1) \] where \( r \) is the number of rows and \( c \) is the number of columns in the contingency table.
- Find the Critical Value and Make a Decision: Compare the calculated chi-square statistic to the critical value from the chi-square distribution table at the desired significance level (e.g., 0.05). If the chi-square statistic exceeds the critical value, reject the null hypothesis.
The chi-square test provides a valuable tool for researchers to test hypotheses about the relationships between categorical variables, allowing them to make informed decisions based on statistical evidence.
Chi-Square Test Overview
The chi-square test is a statistical method used to determine if there is a significant association between two categorical variables. It is a vital tool in hypothesis testing, particularly in analyzing frequency data. The test helps to compare the observed data with the data expected under the null hypothesis of no association.
Types of Chi-Square Tests
- Chi-Square Test of Independence
- Chi-Square Goodness of Fit Test
Chi-Square Test of Independence
This test evaluates whether two categorical variables are independent. For example, it can be used to assess whether gender is independent of educational level in a given population.
- Formulate the hypotheses:
- Null hypothesis (\(H_0\)): The variables are independent.
- Alternative hypothesis (\(H_a\)): The variables are not independent.
- Create a contingency table to summarize the data.
- Calculate the expected frequencies using the formula: \[ E = \frac{(\text{Row Total} \times \text{Column Total})}{\text{Grand Total}} \]
- Compute the chi-square statistic using the formula: \[ \chi^2 = \sum \frac{(O - E)^2}{E} \] where \(O\) is the observed frequency and \(E\) is the expected frequency.
- Determine the degrees of freedom: \[ \text{df} = (\text{number of rows} - 1) \times (\text{number of columns} - 1) \]
- Compare the computed chi-square value to the critical value from the chi-square distribution table to decide whether to reject the null hypothesis.
Chi-Square Goodness of Fit Test
This test assesses whether the observed frequency distribution of a categorical variable matches an expected distribution. It is useful for determining if a sample comes from a population with a specific distribution.
- Formulate the hypotheses:
- Null hypothesis (\(H_0\)): The observed distribution fits the expected distribution.
- Alternative hypothesis (\(H_a\)): The observed distribution does not fit the expected distribution.
- Calculate the expected frequencies based on the theoretical distribution.
- Compute the chi-square statistic using the formula: \[ \chi^2 = \sum \frac{(O - E)^2}{E} \]
- Determine the degrees of freedom: \[ \text{df} = \text{number of categories} - 1 \]
- Compare the computed chi-square value to the critical value from the chi-square distribution table to decide whether to reject the null hypothesis.
Interpreting the Results
The chi-square test results are interpreted by comparing the computed chi-square statistic to a critical value from the chi-square distribution table. If the chi-square statistic exceeds the critical value, the null hypothesis is rejected, indicating a significant association between the variables. Otherwise, the null hypothesis cannot be rejected.
Types of Chi-Square Tests
The chi-square test is a versatile statistical tool used to determine if there is a significant association between categorical variables. There are mainly two types of chi-square tests:
- Chi-Square Test of Independence
- Formulate the null and alternative hypotheses. The null hypothesis states that there is no association between the variables.
- Construct a contingency table to summarize the data.
- Calculate the expected frequencies using the formula:
- Use the chi-square formula to calculate the test statistic:
- Compare the test statistic to the critical value from the chi-square distribution table to determine if the null hypothesis can be rejected.
- Chi-Square Goodness of Fit Test
- Formulate the null and alternative hypotheses. The null hypothesis states that the observed frequencies match the expected frequencies.
- Calculate the expected frequencies based on the hypothesized distribution.
- Compute the chi-square statistic using the same formula:
- Compare the computed chi-square statistic to the critical value from the chi-square distribution table to determine if the null hypothesis can be rejected.
This test determines whether two categorical variables are independent of each other. For example, it can be used to examine if gender and voting preference are related. The steps involved are:
This test determines if a sample data matches a population with a specific distribution. It's often used to see if observed data follows a hypothesized distribution such as normal, binomial, or Poisson. The steps are:
Chi-Square Formula
The chi-square test is used to determine if there is a significant difference between the expected frequencies and the observed frequencies in one or more categories. The formula for the chi-square statistic is:
\[
\chi^2 = \sum \frac{(O_i - E_i)^2}{E_i}
\]
where:
- \( O_i \) = Observed frequency
- \( E_i \) = Expected frequency
The expected frequency for each category is calculated using the formula:
\[
E_i = \frac{\text{Row Total} \times \text{Column Total}}{\text{Grand Total}}
\]
Let's break down the steps for conducting a chi-square test:
- Calculate the expected frequencies for each category.
- Compute the chi-square statistic using the observed and expected frequencies.
- Compare the calculated chi-square statistic to the critical value from the chi-square distribution table with the appropriate degrees of freedom.
- If the chi-square statistic is greater than the critical value, reject the null hypothesis, indicating a significant difference between the observed and expected frequencies.
Here's an example to illustrate the calculation:
| Category A | Category B | Category C | |
| Observed | 30 | 50 | 20 |
| Expected | 33.33 | 33.33 | 33.33 |
Using the formula, we calculate:
\[
\chi^2 = \frac{(30 - 33.33)^2}{33.33} + \frac{(50 - 33.33)^2}{33.33} + \frac{(20 - 33.33)^2}{33.33}
\]
After computing, we compare the chi-square value with the critical value from the chi-square distribution table to make a decision about the null hypothesis.

Steps to Perform a Chi-Square Test
The Chi-Square test is a statistical method used to determine if there is a significant association between two categorical variables. Here are the steps to perform a Chi-Square test:
- State the Hypotheses:
- Null Hypothesis (H0): There is no association between the variables.
- Alternative Hypothesis (H1): There is an association between the variables.
- Create a Contingency Table:
Organize the observed frequencies of the variables into a matrix format, showing the count of occurrences for each combination of categories.
Category A Category B Total Observed frequency 1 Observed frequency 2 Row Total Observed frequency 3 Observed frequency 4 Row Total Column Total Column Total Grand Total - Calculate Expected Frequencies:
Use the formula to find the expected frequency for each cell:
\[ E = \dfrac{(\text{Row Total} \times \text{Column Total})}{\text{Grand Total}} \]
- Compute the Chi-Square Statistic:
Apply the Chi-Square formula:
\[ \chi^2 = \sum \dfrac{(O - E)^2}{E} \]
Where \( O \) represents the observed frequency and \( E \) represents the expected frequency.
- Determine the Degrees of Freedom:
The degrees of freedom for a Chi-Square test are calculated as:
\[ df = (r - 1) \times (c - 1) \]
Where \( r \) is the number of rows and \( c \) is the number of columns in the contingency table.
- Find the Critical Value:
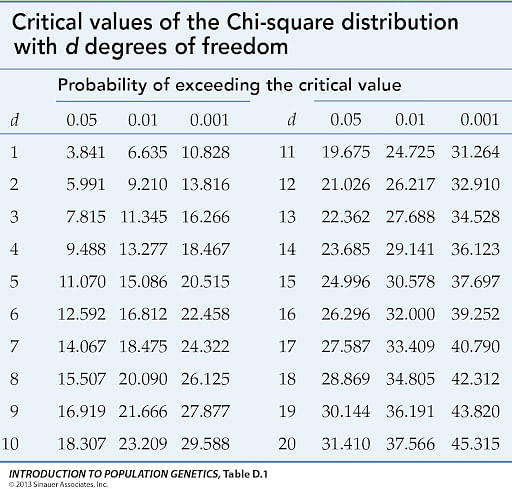
Using the degrees of freedom and the significance level (commonly 0.05), find the critical value from a Chi-Square distribution table.
- Compare the Chi-Square Statistic to the Critical Value:
If the Chi-Square statistic is greater than the critical value, reject the null hypothesis. Otherwise, fail to reject the null hypothesis.
- Interpret the Results:
Based on the comparison, conclude whether there is a significant association between the categorical variables.
Chi-Square Test Solved Examples
The Chi-Square test is commonly used in statistical analysis to compare observed and expected frequencies. Here are detailed, step-by-step solved examples to illustrate its application:
Example 1: Goodness of Fit Test
Suppose a die is rolled 60 times, and the results are recorded as follows:
| Face | Observed Frequency (Oi) | Expected Frequency (Ei) |
|---|---|---|
| 1 | 8 | 10 |
| 2 | 12 | 10 |
| 3 | 9 | 10 |
| 4 | 11 | 10 |
| 5 | 10 | 10 |
| 6 | 10 | 10 |
Using the chi-square formula:
\[
\chi^2 = \sum \frac{(O_i - E_i)^2}{E_i}
\]
Calculate for each face of the die:
- For face 1: \(\frac{(8-10)^2}{10} = 0.4\)
- For face 2: \(\frac{(12-10)^2}{10} = 0.4\)
- For face 3: \(\frac{(9-10)^2}{10} = 0.1\)
- For face 4: \(\frac{(11-10)^2}{10} = 0.1\)
- For face 5: \(\frac{(10-10)^2}{10} = 0\)
- For face 6: \(\frac{(10-10)^2}{10} = 0\)
Total \(\chi^2 = 0.4 + 0.4 + 0.1 + 0.1 + 0 + 0 = 1.0\)
Compare the chi-square statistic to the critical value from the chi-square distribution table with 5 degrees of freedom at the 0.05 significance level. If \(\chi^2\) is less than the critical value, we fail to reject the null hypothesis.
Example 2: Test of Independence
Consider a survey to test the independence between gender (male, female) and preference for a new product (like, dislike). The observed frequencies are:
| Like | Dislike | Total | |
|---|---|---|---|
| Male | 30 | 10 | 40 |
| Female | 20 | 40 | 60 |
| Total | 50 | 50 | 100 |
Calculate the expected frequencies:
- Expected frequency for males who like the product: \(\frac{40 \times 50}{100} = 20\)
- Expected frequency for males who dislike the product: \(\frac{40 \times 50}{100} = 20\)
- Expected frequency for females who like the product: \(\frac{60 \times 50}{100} = 30\)
- Expected frequency for females who dislike the product: \(\frac{60 \times 50}{100} = 30\)
Using the chi-square formula:
\[
\chi^2 = \sum \frac{(O_i - E_i)^2}{E_i}
\]
Calculate for each cell:
- Males who like: \(\frac{(30-20)^2}{20} = 5\)
- Males who dislike: \(\frac{(10-20)^2}{20} = 5\)
- Females who like: \(\frac{(20-30)^2}{30} = 3.33\)
- Females who dislike: \(\frac{(40-30)^2}{30} = 3.33\)
Total \(\chi^2 = 5 + 5 + 3.33 + 3.33 = 16.66\)
Compare the chi-square statistic to the critical value from the chi-square distribution table with 1 degree of freedom at the 0.05 significance level. If \(\chi^2\) is greater than the critical value, we reject the null hypothesis, indicating a significant association between gender and product preference.
Chi-Square Distribution
The chi-square (Χ2) distribution is a continuous probability distribution widely used in statistical hypothesis testing, particularly with chi-square tests. It helps determine whether there is a significant difference between observed and expected frequencies in categorical data.
Key characteristics of the chi-square distribution include:
- It is defined only for non-negative values.
- The shape of the distribution depends on the degrees of freedom (df).
- As the degrees of freedom increase, the distribution becomes more symmetric and approaches a normal distribution.
Relationship to the Standard Normal Distribution
The chi-square distribution is closely related to the standard normal distribution. If you take a random sample from a standard normal distribution and square each value, the result follows a chi-square distribution with one degree of freedom. More generally, if you sum the squares of k independent standard normal variables, the result follows a chi-square distribution with k degrees of freedom:
\[ \chi^2_k = (Z_1)^2 + (Z_2)^2 + \ldots + (Z_k)^2 \]
Properties of the Chi-Square Distribution
- The mean of a chi-square distribution is equal to its degrees of freedom (\(k\)).
- The variance of a chi-square distribution is equal to two times its degrees of freedom (2k).
- The distribution is positively skewed, but the skew decreases with more degrees of freedom.
Applications
Chi-square distributions are primarily used in the following types of tests:
- Chi-Square Goodness of Fit Test: Determines if a sample matches an expected distribution.
- Chi-Square Test of Independence: Assesses whether two categorical variables are independent.
Finding P-Values and Critical Values
To perform a chi-square test, you calculate the chi-square statistic using the formula:
\[ \chi^2 = \sum \frac{(O_i - E_i)^2}{E_i} \]
Where \(O_i\) is the observed frequency and \(E_i\) is the expected frequency. The p-value is then determined based on the chi-square statistic and the degrees of freedom. If the p-value is less than or equal to the significance level (typically 0.05), the null hypothesis is rejected.
The chi-square distribution is an essential tool in statistical analysis, allowing researchers to test hypotheses about the relationships and distributions of categorical variables effectively.
Finding P-Values and Critical Values
To determine the statistical significance of a chi-square test result, we need to find the p-value and compare the chi-square statistic to the critical value. Here's how you can do it:
Steps to Find the P-Value
- Calculate the Chi-Square Statistic: Use the formula:
\[\chi^2 = \sum \frac{(O_i - E_i)^2}{E_i}\]
where \(O_i\) is the observed frequency and \(E_i\) is the expected frequency. - Determine Degrees of Freedom: The degrees of freedom (df) for a chi-square test is calculated as:
\[df = (r - 1) \times (c - 1)\]
where \(r\) is the number of rows and \(c\) is the number of columns in the contingency table. - Use a Chi-Square Distribution Table: Find the critical value for the chi-square statistic based on your degrees of freedom and the desired significance level (commonly \(\alpha = 0.05\)).
- Compare the Chi-Square Statistic to the Critical Value:
- If the chi-square statistic is greater than the critical value, the p-value is less than \(\alpha\) and you reject the null hypothesis.
- If the chi-square statistic is less than the critical value, the p-value is greater than \(\alpha\) and you fail to reject the null hypothesis.
Example Calculation
Consider a study to determine if there is a significant association between gender and political party preference. The observed frequencies are tabulated, and the expected frequencies are calculated based on the null hypothesis that there is no association.
| Gender | Party A (Observed) | Party B (Observed) | Party A (Expected) | Party B (Expected) |
|---|---|---|---|---|
| Male | 30 | 20 | 25 | 25 |
| Female | 20 | 30 | 25 | 25 |
Calculate the chi-square statistic:
\[\chi^2 = \frac{(30 - 25)^2}{25} + \frac{(20 - 25)^2}{25} + \frac{(20 - 25)^2}{25} + \frac{(30 - 25)^2}{25}\]
\[\chi^2 = 1 + 1 + 1 + 1 = 4\]
Degrees of Freedom
For this example, \(df = (2-1) \times (2-1) = 1\).
Using the Chi-Square Distribution Table
For \(df = 1\) and \(\alpha = 0.05\), the critical value from the chi-square distribution table is 3.841.
Since 4 > 3.841, we reject the null hypothesis and conclude that there is a significant association between gender and political party preference.
Conclusion
The p-value indicates the probability that the observed differences are due to chance. If the p-value is less than the significance level, the null hypothesis is rejected, suggesting a significant association between the variables.
Chi-Square Test Applications
The Chi-Square test is widely used in various fields to analyze categorical data. Here are some common applications:
-
Survey Data Analysis
The Chi-Square test is often used in surveys to test hypotheses about the distribution of categorical variables. For example, it can determine if there is a significant association between demographic factors (like age or gender) and preferences for certain products or services.
-
Market Research
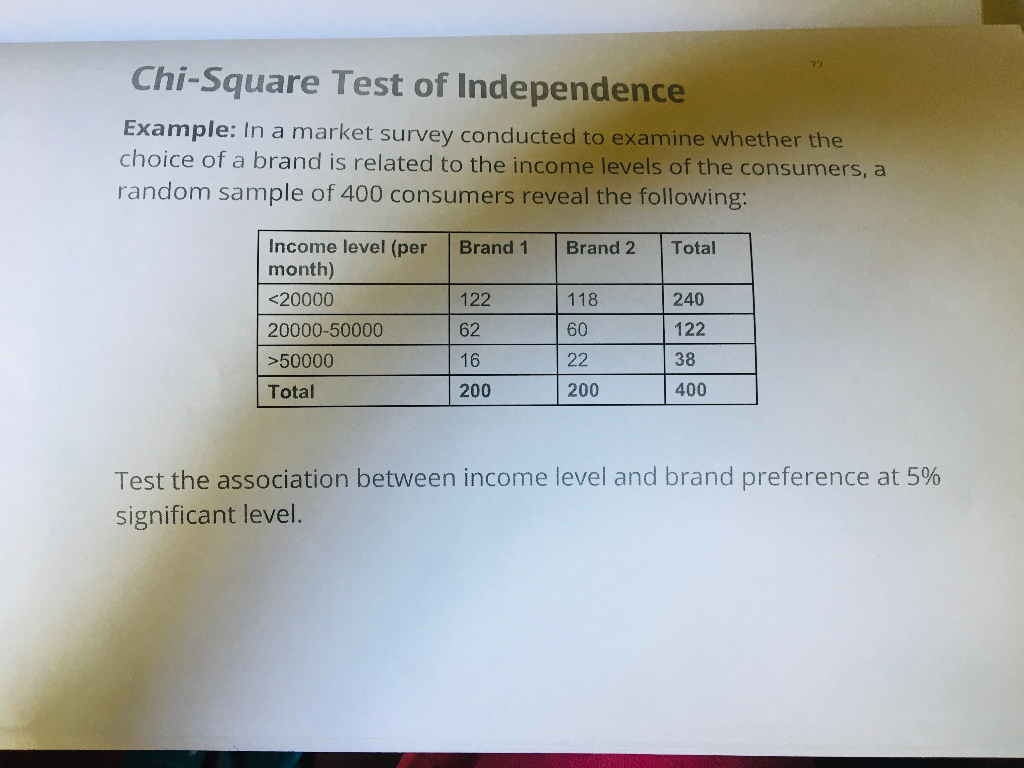
In market research, the Chi-Square test helps to assess consumer behavior and preferences. Companies use it to evaluate if there is a relationship between customer characteristics and purchasing decisions, such as the association between income level and the likelihood of buying a particular product.
-
Biological Studies
The Chi-Square test is frequently used in biological research to examine the relationships between genetic traits and environmental factors. For example, it can test the hypothesis that a certain genotype is associated with susceptibility to a disease.
-
Healthcare and Medicine
In healthcare, Chi-Square tests are used to study the relationship between patient characteristics and health outcomes. This can include analyzing the effectiveness of treatments across different patient groups or understanding the association between lifestyle factors and disease incidence.
-
Education and Social Sciences
Researchers in education and social sciences use the Chi-Square test to investigate relationships between categorical variables, such as the impact of different teaching methods on student performance or the association between social background and educational attainment.
-
Criminology
In criminology, the Chi-Square test helps to explore the relationship between demographic factors and crime rates. For example, it can test whether there is a significant association between age and the likelihood of committing a particular type of crime.
Overall, the Chi-Square test is a versatile statistical tool that provides valuable insights across numerous fields by helping researchers to identify and understand patterns and associations in categorical data.
Chi-Square Test FAQs
Here are some frequently asked questions about the Chi-Square Test:
-
What is the Chi-Square Test?
The Chi-Square Test is a statistical method used to determine if there is a significant association between two categorical variables. It helps to test the independence or goodness of fit of observed data with expected data.
-
When should I use a Chi-Square Test?
The Chi-Square Test is applicable when you have categorical data and want to see if distributions of categorical variables differ from each other. Common applications include survey analysis, market research, and any research involving categorical data.
-
What are the types of Chi-Square Tests?
There are two main types of Chi-Square Tests:
- Chi-Square Test of Independence: Tests if two categorical variables are independent.
- Chi-Square Goodness of Fit Test: Tests if a sample matches a population with a specific distribution.
-
How do I calculate the Chi-Square statistic?The Chi-Square statistic is calculated using the formula:
\[
\chi^2 = \sum \frac{(O_i - E_i)^2}{E_i}
\]
where \( O_i \) is the observed frequency and \( E_i \) is the expected frequency. -
What is the significance level in a Chi-Square Test?
The significance level, often denoted by alpha (\(\alpha\)), is the probability of rejecting the null hypothesis when it is actually true. Common significance levels are 0.05 (5%) and 0.01 (1%).
-
How do I interpret the p-value in a Chi-Square Test?
The p-value indicates the probability that the observed data would occur by chance if the null hypothesis were true. A p-value less than or equal to the significance level means you reject the null hypothesis, suggesting there is a significant association between the variables.
-
What are degrees of freedom in the context of a Chi-Square Test?
Degrees of freedom (df) are calculated based on the number of categories in the variables. For the Chi-Square Test of Independence, it is calculated as:
\[
\text{df} = (r - 1) \times (c - 1)
\]
where \( r \) is the number of rows and \( c \) is the number of columns in the contingency table. -
What are the limitations of the Chi-Square Test?
Some limitations include:
- It requires a large sample size to be accurate.
- It is sensitive to sample size; with large samples, even small differences can become significant.
- It cannot be used for continuous data without converting it to categorical data.
Video này cung cấp hướng dẫn chi tiết về kiểm định Chi-Square và các ví dụ đã giải để giúp bạn hiểu rõ hơn về phương pháp này.
Kiểm Định Chi-Square
READ MORE:
Video này hướng dẫn chi tiết cách thực hiện kiểm định Chi-Square bằng tay và các ví dụ đã giải để giúp bạn nắm vững phương pháp này.
Cách Thực Hiện Kiểm Định Chi-Square (Bằng Tay)

