Topic what are chi-square tests used for: Chi-Square tests are essential statistical tools used to determine if there is a significant association between categorical variables. This comprehensive guide will explore the different types of Chi-Square tests, their applications, assumptions, and limitations, as well as provide examples and case studies to enhance understanding.
Table of Content
- What are Chi-Square Tests Used For?
- Introduction to Chi-Square Tests
- Applications of Chi-Square Tests
- Assumptions and Limitations
- Conducting a Chi-Square Test
- Interpreting Results
- Examples and Case Studies
- FAQs about Chi-Square Tests
- YOUTUBE: Tìm hiểu về kiểm định Chi-Square và các ứng dụng của nó trong phân tích dữ liệu.
What are Chi-Square Tests Used For?
Chi-square tests are statistical methods used to determine if there is a significant difference between the expected and observed data. They are particularly useful in the analysis of categorical data.
Types of Chi-Square Tests
Chi-Square Test of Independence
This test determines whether two categorical variables are independent of each other. It compares the observed frequencies of events to the frequencies expected if the events were independent.
Example
Imagine a city wants to test whether recycling behavior is influenced by receiving a flyer or a phone call. The data is organized in a contingency table:
| Intervention | Recycles | Does not recycle | Row totals |
|---|---|---|---|
| Flyer | 89 | 9 | 98 |
| Phone call | 84 | 8 | 92 |
| Control | 86 | 24 | 110 |
| Column totals | 259 | 41 | N = 300 |
Chi-Square Goodness of Fit Test
This test determines whether a sample data matches a population with a specific distribution. It's used to see how well the sample data fits the expected distribution.
Example
Suppose you want to test if a die is fair. The expected frequency for each face (1-6) should be equal if the die is fair. If your observed data significantly deviates from this expectation, the die may not be fair.
How to Perform a Chi-Square Test
- Define the null and alternative hypotheses.
- Calculate the expected frequencies based on the null hypothesis.
- Use the formula \( \chi^2 = \sum \frac{(O_i - E_i)^2}{E_i} \), where \( O_i \) is the observed frequency and \( E_i \) is the expected frequency.
- Compare the calculated \( \chi^2 \) value to the critical value from the chi-square distribution table.
- Determine the p-value and conclude whether to reject the null hypothesis.
Key Points
- Chi-square tests are nonparametric and do not assume a normal distribution.
- They require that the expected frequency of each category is at least 5.
- The larger the sample size, the more reliable the results.
Limitations
- Chi-square tests are sensitive to sample size.
- They only indicate if there is an association, not causation.
:max_bytes(150000):strip_icc()/Chi-SquareStatistic_Final_4199464-7eebcd71a4bf4d9ca1a88d278845e674.jpg)
READ MORE:
Introduction to Chi-Square Tests
The Chi-Square test is a statistical method used to determine if there is a significant association between two categorical variables. It helps researchers understand whether the observed distribution of data differs from the expected distribution, allowing them to assess whether any relationship exists between the variables being studied. There are two main types of Chi-Square tests: the Chi-Square Goodness of Fit Test and the Chi-Square Test of Independence.
The Chi-Square Goodness of Fit Test evaluates whether a sample data matches a population with a specific distribution. This test is useful when you want to determine if a categorical variable follows a hypothesized distribution. For example, a shop owner might use this test to check if an equal number of customers visit each day of the week.
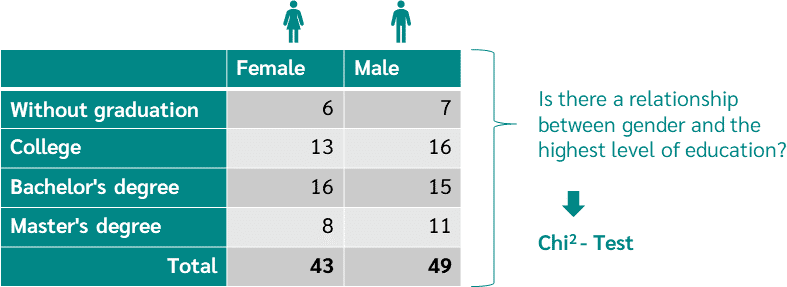
The Chi-Square Test of Independence assesses whether two categorical variables are related. This test is used to determine if there is a significant association between variables such as gender and voting preference or education level and marital status.
The Chi-Square test works by comparing the observed frequencies in each category to the expected frequencies, which are calculated based on the assumption of independence. The test statistic, denoted as \(X^2\), follows a Chi-Square distribution. The formula for the test statistic is:
\[ X^2 = \sum \frac{(O_i - E_i)^2}{E_i} \]
where \(O_i\) is the observed frequency and \(E_i\) is the expected frequency. The degrees of freedom for the test are calculated based on the number of categories or variables involved.
Chi-Square tests are widely used in various fields, including social sciences, marketing, and medical research, to analyze categorical data and draw meaningful conclusions about relationships between variables.
Applications of Chi-Square Tests
Chi-Square tests are widely used in various fields to analyze categorical data. They help researchers determine whether there is a significant association between variables or if an observed distribution matches an expected one. Here are some key applications of Chi-Square tests:
- Market Research: Chi-Square tests are used to examine consumer preferences and behavior. For example, a company might test if the preference for a product is independent of age groups.
- Medicine: In clinical trials, Chi-Square tests can compare the effectiveness of different treatments. For instance, researchers might use it to see if there is a significant difference in recovery rates between two treatments for a disease.
- Psychology: Chi-Square tests are used to analyze survey data. Psychologists might investigate if there is a significant relationship between gender and stress levels among participants.
- Education: These tests can evaluate if student performance in different subjects is independent of teaching methods. Schools might use Chi-Square tests to assess if a new teaching method significantly impacts student grades.
- Political Science: Researchers use Chi-Square tests to analyze voting patterns and preferences. For example, they might test if voting behavior is independent of socioeconomic status.
In each of these applications, the Chi-Square test provides a robust method for testing hypotheses about categorical data, making it a valuable tool in research and data analysis.
Assumptions and Limitations
The Chi-Square Test is a powerful statistical tool used to analyze relationships between categorical variables. However, it is essential to understand its underlying assumptions and limitations to ensure accurate results.
Assumptions
- Random Sampling: The data must be a random sample from the population.
- Independence: Each observation should be independent of the others. No individual should be counted more than once.
- Categorical Data: The variables should be categorical (nominal or ordinal) and should fit into mutually exclusive and exhaustive categories.
- Expected Frequency: The expected frequency in each cell of the contingency table should be at least 5. If this condition is not met, the results might not be reliable.
Limitations
- Sample Size: The test can be inaccurate with very small sample sizes or if the expected frequency in any cell is less than 5. This can lead to increased chances of Type I or Type II errors.
- Only for Categorical Data: The Chi-Square Test cannot be used for continuous data without first converting it into categories, which can lead to loss of information.
- Assumes Independence: The test assumes that all observations are independent. Violation of this assumption can lead to incorrect conclusions.
- No Measure of Strength: While the Chi-Square Test can tell if there is an association, it does not provide information about the strength or direction of the relationship. Additional measures like Cramer's V or Phi coefficient are needed for this purpose.
In conclusion, while the Chi-Square Test is a versatile tool in statistical analysis, careful consideration of its assumptions and limitations is crucial for valid and reliable results.
Conducting a Chi-Square Test
Conducting a Chi-Square test involves several systematic steps to ensure accurate results. This guide will walk you through the process step-by-step.
- Define Hypotheses:
State the null hypothesis (\(H_0\)) and the alternative hypothesis (\(H_1\)). For example, for a test of independence, \(H_0\) might state that two categorical variables are independent, while \(H_1\) suggests they are not.
- Collect Data:
Gather the observed frequencies for each category or group. This data is typically displayed in a contingency table.
- Calculate Expected Frequencies:
Using the formula \(E = \dfrac{(row\ total) \times (column\ total)}{grand\ total}\), compute the expected frequency for each cell in the contingency table.
- Compute the Test Statistic:
Use the formula \(\chi^2 = \sum \dfrac{(O-E)^2}{E}\) where \(O\) is the observed frequency and \(E\) is the expected frequency. Sum this calculation for all cells in the table.
- Determine Degrees of Freedom:
Calculate the degrees of freedom using the formula \(df = (number\ of\ rows - 1) \times (number\ of\ columns - 1)\).
- Find the Critical Value and P-Value:
Using a Chi-Square distribution table, find the critical value corresponding to the calculated degrees of freedom and the chosen significance level (e.g., 0.05). Compare the test statistic to the critical value or use the p-value approach to determine significance.
- Make a Decision:
If the test statistic exceeds the critical value or if the p-value is less than the significance level, reject the null hypothesis. Otherwise, fail to reject the null hypothesis.
- State the Conclusion:
Interpret the results in the context of the research question. Clearly state whether there is sufficient evidence to support the alternative hypothesis.
This structured approach ensures a thorough and accurate application of the Chi-Square test.
Interpreting Results
Interpreting the results of a Chi-Square test involves several key steps:
-
Determine Statistical Significance:
Compare the p-value to the significance level (typically \(\alpha = 0.05\)). If \(p \leq \alpha\), reject the null hypothesis, indicating a statistically significant association between the variables.
-
Examine the Chi-Square Statistic:
Look at the calculated Chi-Square statistic and compare it to the critical value from the Chi-Square distribution table based on the degrees of freedom. A higher statistic suggests a greater deviation from the null hypothesis.
-
Analyze the Residuals:
Inspect the differences between observed and expected frequencies. Large residuals indicate cells that contribute most to the Chi-Square statistic and potential areas of association.
-
Consider the Effect Size:
Use measures like Cramer's V or the Phi coefficient to assess the strength of the association. These metrics provide a standardized way to interpret the magnitude of the relationship.
-
Contextualize the Findings:
Relate the statistical results to the research question and consider practical implications. Ensure the findings are meaningful and relevant to the context of the study.
For example, if a Chi-Square test of independence yields a p-value of 0.03 with a Chi-Square statistic of 15.2 and 3 degrees of freedom, you would conclude that there is a statistically significant association between the variables, as the p-value is less than 0.05.
Examples and Case Studies
Chi-Square tests are widely used in various fields to test hypotheses about categorical data. Here are some detailed examples and case studies:
Example 1: Voting Preferences and Gender
Researchers surveyed 500 voters to determine if there is a significant association between gender and political party preference. They recorded the gender and party preference of each voter and performed a Chi-Square Test of Independence. The results showed a significant association, indicating that gender may influence voting preferences.
Example 2: Customer Distribution in a Shop
A shop owner wants to know if the number of customers is evenly distributed across the days of the week. They counted the number of customers for each day and used a Chi-Square Goodness of Fit Test. The test revealed that the distribution of customers is not equal, suggesting that some days are busier than others.
Example 3: Testing a Die for Fairness
A researcher rolls a die 50 times to check if it is fair. They record the frequency of each number from 1 to 6 and use a Chi-Square Goodness of Fit Test. The test shows that the die is fair, as the observed frequencies match the expected frequencies for a fair die.
Example 4: M&M's Color Distribution
To determine if the color distribution of M&M's in a bag matches the manufacturer's claim (e.g., 20% yellow, 30% blue, 30% red, 20% other), a Chi-Square Goodness of Fit Test is conducted. The results indicate whether the observed color frequencies match the expected distribution.
Example 5: Education Level and Marital Status
Researchers investigate if there is an association between education level and marital status in a sample of 2,000 individuals. Using a Chi-Square Test of Independence, they find a significant association, suggesting that education level may influence marital status.
Case Study: Fatalities by Shirt Color
A study examines if there is a relationship between shirt color and the likelihood of fatalities in a fictional scenario. Using a Chi-Square Test of Independence, the study finds that certain shirt colors are associated with higher fatality rates.
These examples illustrate how Chi-Square tests can be applied to real-world data to uncover significant associations and test hypotheses about categorical variables.
FAQs about Chi-Square Tests
-
What is a Chi-Square Test?
A Chi-Square Test is a statistical method used to determine if there is a significant association between categorical variables. It compares the observed frequencies of events to the frequencies we would expect if there were no association between the variables.
-
When should I use a Chi-Square Test?
Use a Chi-Square Test when you want to examine the relationship between two categorical variables. For example, it is appropriate when you have survey data on people's preferences and demographic information and want to see if preferences vary by demographic groups.
-
What are the types of Chi-Square Tests?
- Chi-Square Test of Independence: Used to determine if there is a significant relationship between two categorical variables.
- Chi-Square Goodness of Fit Test: Used to see if a sample data matches a population with a specific distribution.
-
What are the assumptions of a Chi-Square Test?
- The data must be in the form of frequencies or counts of cases.
- The categories must be mutually exclusive.
- The sample size should be sufficiently large. Generally, the expected frequency in each cell of the table should be at least 5.
- The observations should be independent of each other.
-
How do I interpret the results of a Chi-Square Test?
The results are interpreted by comparing the p-value to a significance level (usually 0.05). If the p-value is less than the significance level, you reject the null hypothesis and conclude that there is a significant association between the variables.
-
What are degrees of freedom in Chi-Square Tests?
Degrees of freedom (df) in a Chi-Square Test are calculated based on the number of categories being analyzed. For the Test of Independence, df is calculated as (number of rows - 1) * (number of columns - 1). For the Goodness of Fit Test, df is the number of categories minus 1.
-
What are common applications of Chi-Square Tests?
Chi-Square Tests are commonly used in fields such as marketing, finance, medicine, and social sciences to test hypotheses about the relationships between categorical variables. For example, they can be used to analyze customer preference data, determine the effectiveness of different treatments, or study the association between lifestyle factors and health outcomes.
-
What are the limitations of Chi-Square Tests?
- The test is sensitive to sample size; large samples can detect small differences that may not be practically significant.
- It only tests for association, not causation. A significant result indicates a relationship between variables, but further analysis is needed to determine causality.
Tìm hiểu về kiểm định Chi-Square và các ứng dụng của nó trong phân tích dữ liệu.
Kiểm Định Chi-Square
READ MORE:
Kiểm tra Chi-square: Thống kê học nhanh #29
Kiểm tra Chi-square: Thống kê học nhanh #29