Topic graphing square root functions worksheet: Explore the fascinating world of graphing square root functions with this comprehensive worksheet. Learn how to identify domains and ranges, apply transformations, and solve real-world problems through detailed explanations and interactive practice. Perfect for students and educators alike, this guide will enhance your understanding and mastery of square root functions.
Table of Content
- Graphing Square Root Functions Worksheet
- Introduction to Square Root Functions
- Identifying Domain and Range
- Basic Graphing Techniques
- Transformations of Square Root Functions
- Horizontal and Vertical Shifts
- Reflections and Dilations
- Graphing Practice Problems
- Applications and Real-World Examples
- Advanced Concepts: Cube Root Functions
- Common Mistakes and Troubleshooting
- Interactive Tools and Resources
- YOUTUBE:
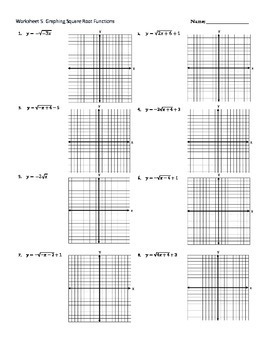
Graphing Square Root Functions Worksheet
Explore the world of graphing square root functions with these comprehensive worksheets. Perfect for students looking to enhance their understanding of square root functions and their graphical representations.
Introduction
Graphing square root functions involves plotting points that satisfy the function and then connecting these points to reveal the shape of the graph. The basic square root function is denoted as \( \sqrt{x} \), and its graph typically starts at the origin (0,0) and rises steadily.
Steps to Graph Square Root Functions
- Identify the basic form of the square root function: \( y = \sqrt{x} \).
- Determine the domain and range:
- Domain: \( x \geq 0 \)
- Range: \( y \geq 0 \)
- Choose values for \( x \) and compute corresponding \( y \) values.
- Plot the points \((x, y)\) on a graph.
- Connect the points with a smooth curve.
Example Problems
- Problem 1: Graph the function \( y = \sqrt{x - 2} \)
- Shift the graph of \( y = \sqrt{x} \) two units to the right.
- Plot points and connect them to form the graph.
- Problem 2: Graph the function \( y = 2\sqrt{x} + 1 \)
- Vertically stretch the graph of \( y = \sqrt{x} \) by a factor of 2.
- Shift the graph one unit up.
Practice Worksheet
These practice worksheets help reinforce the concepts by providing problems that require students to graph square root functions and identify transformations. Each worksheet includes a set of functions to graph, space to draw the graphs, and questions to analyze the transformations.
Homework Sheets
| Sheet | Description |
|---|---|
| Homework 1 | Solve linear functions and graph \( f(x) = \sqrt{x^2 + 5} \). |
| Homework 2 | Plot points for given inequality equations. |
| Homework 3 | Change equations into the form \( y = mx + c \) and plot points. |
Quizzes
Test your knowledge with quizzes that involve drawing square root functions and interpreting their graphs. These quizzes are designed to challenge your understanding and provide instant feedback.
Additional Resources
For more detailed explanations and additional practice, check out the guided lessons and answer keys available with the worksheets. These resources provide step-by-step instructions and solutions to help you master graphing square root functions.

READ MORE:
Introduction to Square Root Functions
Square root functions are a fundamental concept in algebra, representing the relationship between a number and its square root. The general form of a square root function is \( f(x) = \sqrt{x} \). These functions have unique characteristics and transformations that can be visualized on a graph.
Here is a step-by-step guide to understanding and graphing square root functions:
-
Identifying the Domain and Range:
The domain of \( f(x) = \sqrt{x} \) is \( x \geq 0 \) because the square root of a negative number is not a real number. The range is also \( y \geq 0 \), as the square root function produces non-negative outputs.
-
Plotting Basic Points:
Start by selecting a few key values of \( x \) within the domain (e.g., 0, 1, 4, 9) and calculating the corresponding \( y \)-values (0, 1, 2, 3 respectively). This helps in plotting the initial points on the graph.
-
Graphing the Parent Function:
Plot the points obtained from the basic square root function on a coordinate plane. Connect these points with a smooth curve starting from the origin (0,0).
-
Applying Transformations:
-
Horizontal Shifts:
For \( f(x) = \sqrt{x - h} \), the graph shifts horizontally by \( h \) units. If \( h \) is positive, the shift is to the right; if negative, to the left.
-
Vertical Shifts:
For \( f(x) = \sqrt{x} + k \), the graph shifts vertically by \( k \) units. If \( k \) is positive, the shift is upward; if negative, downward.
-
Reflections:
The function \( f(x) = -\sqrt{x} \) reflects the graph across the x-axis, while \( f(x) = \sqrt{-x} \) reflects it across the y-axis.
-
Stretching and Shrinking:
For \( f(x) = a\sqrt{x} \), if \( |a| > 1 \), the graph stretches vertically; if \( 0 < |a| < 1 \), it shrinks.
-
Horizontal Shifts:
By understanding these steps and transformations, one can effectively graph any square root function and analyze its behavior on a coordinate plane. This foundation is essential for progressing in algebra and other advanced mathematical topics.
Identifying Domain and Range
Understanding the domain and range of square root functions is crucial for accurate graphing. The domain of a function consists of all possible input values (x-values) that produce a real number output when substituted into the function. For square root functions, the argument inside the square root must be non-negative because the square root of a negative number is not a real number.
To identify the domain of a square root function, set the expression inside the square root greater than or equal to zero and solve for x:
- For example, for the function \( f(x) = \sqrt{x - 2} \), solve \( x - 2 \geq 0 \). This simplifies to \( x \geq 2 \). Thus, the domain is \( x \geq 2 \).
The range of a function consists of all possible output values (y-values). Since the square root function outputs non-negative values, the range will be all non-negative real numbers. For \( f(x) = \sqrt{x - 2} \), the smallest value is 0 when \( x = 2 \), and it increases without bound as x increases.
Here’s a step-by-step approach to finding the domain and range of square root functions:
- Identify the expression inside the square root.
- Set the expression inside the square root greater than or equal to zero.
- Solve the inequality to find the domain.
- Determine the range based on the smallest value of the function and how it behaves as x increases.
Let's consider another example:
For the function \( g(x) = \sqrt{4 - x^2} \):
- Set \( 4 - x^2 \geq 0 \).
- Solve \( 4 \geq x^2 \), which simplifies to \( -2 \leq x \leq 2 \).
Thus, the domain is \( -2 \leq x \leq 2 \). The range is from 0 to 2, as the maximum value of \( g(x) \) occurs when \( x = 0 \), giving \( g(0) = \sqrt{4 - 0^2} = 2 \).
By following these steps, you can accurately determine the domain and range of any square root function, ensuring precise graphing and understanding of the function's behavior.
Basic Graphing Techniques
Graphing square root functions involves several key steps to ensure accuracy and clarity. Below is a step-by-step guide to help you master the basic techniques:
-
Identify the Function:
Determine the form of the square root function you are working with, typically written as \( y = \sqrt{x} \) or a variant involving transformations.
-
Find the Domain:
Since the square root function is only defined for non-negative inputs, set the radicand (the expression inside the square root) greater than or equal to zero and solve for \( x \). This gives you the valid range of \( x \) values to use.
- Example: For \( y = \sqrt{x - 2} \), solve \( x - 2 \geq 0 \) to get \( x \geq 2 \).
-
Create a Table of Values:
Select a set of \( x \) values within the domain and calculate the corresponding \( y \) values. This table will provide the points to plot on the graph.
\( x \) \( y \) 2 0 3 1 6 2 -
Plot the Points:
Using graph paper or a graphing tool, plot the points from your table onto the coordinate plane.
-
Draw the Curve:
Connect the plotted points with a smooth curve. The graph of a square root function typically starts at the vertex and increases slowly to the right.
-
Check for Transformations:
If your function includes transformations such as shifts, reflections, or stretching/compressing, apply these changes accordingly.
- Horizontal shift: \( y = \sqrt{x - h} \)
- Vertical shift: \( y = \sqrt{x} + k \)
- Reflection: \( y = -\sqrt{x} \)
- Stretch/Compression: \( y = a\sqrt{x} \)
By following these steps, you can accurately graph any square root function, enhancing your understanding of their behaviors and characteristics.
Transformations of Square Root Functions
Transformations of square root functions involve changing the function's position, shape, or orientation on the graph. These transformations can include translations (shifts), reflections, and dilations (stretching or compressing). Below are the different types of transformations and how they affect the square root function \( f(x) = \sqrt{x} \).
Horizontal and Vertical Shifts
Horizontal and vertical shifts move the graph of the function without altering its shape. They are represented by adding or subtracting constants inside or outside the square root.
- Horizontal Shift: \( f(x) = \sqrt{x - h} \)
- If \( h > 0 \), the graph shifts to the right by \( h \) units.
- If \( h < 0 \), the graph shifts to the left by \( |h| \) units.
- Vertical Shift: \( f(x) = \sqrt{x} + k \)
- If \( k > 0 \), the graph shifts up by \( k \) units.
- If \( k < 0 \), the graph shifts down by \( |k| \) units.
Reflections
Reflections flip the graph over a specific axis. They are represented by multiplying the function by -1.
- Reflection across the x-axis: \( f(x) = -\sqrt{x} \)
- The graph is flipped upside down.
- Reflection across the y-axis: \( f(x) = \sqrt{-x} \)
- The graph is reflected over the y-axis (for this function, it only makes sense if \( x \leq 0 \)).
Dilations
Dilations involve stretching or compressing the graph vertically or horizontally. This is done by multiplying the function by a constant factor.
- Vertical Stretch/Compression: \( f(x) = a\sqrt{x} \)
- If \( |a| > 1 \), the graph is stretched vertically.
- If \( 0 < |a| < 1 \), the graph is compressed vertically.
- Horizontal Stretch/Compression: \( f(x) = \sqrt{bx} \)
- If \( |b| > 1 \), the graph is compressed horizontally.
- If \( 0 < |b| < 1 \), the graph is stretched horizontally.
Examples
Here are some examples to illustrate these transformations:
- Example 1: \( f(x) = \sqrt{x} + 3 \) shifts the graph of \( \sqrt{x} \) up by 3 units.
- Example 2: \( f(x) = \sqrt{x - 2} \) shifts the graph of \( \sqrt{x} \) right by 2 units.
- Example 3: \( f(x) = -\sqrt{x} \) reflects the graph of \( \sqrt{x} \) across the x-axis.
- Example 4: \( f(x) = 2\sqrt{x} \) stretches the graph of \( \sqrt{x} \) vertically by a factor of 2.

Horizontal and Vertical Shifts
Understanding how horizontal and vertical shifts affect the graph of a square root function is crucial for mastering graph transformations. The general form of a square root function with shifts is:
y = a√(x - h) + k
where:
ais the vertical stretch/compression factor.his the horizontal shift.kis the vertical shift.
Let's break down the effects of h and k on the graph of the basic square root function y = √x.
Horizontal Shifts
Horizontal shifts occur when a constant h is added to or subtracted from the variable x inside the square root. The function y = √(x - h) will shift the graph to the right if h is positive, and to the left if h is negative.
Examples:
y = √(x - 3)shifts the graph 3 units to the right.y = √(x + 2)shifts the graph 2 units to the left.
To graph these functions:
- Identify the value of
hin the function. - Shift the basic graph of
y = √xhorizontally byhunits.
For example, the graph of y = √(x - 3) starts at the point (3, 0) instead of (0, 0).
Vertical Shifts
Vertical shifts occur when a constant k is added to or subtracted from the entire function. The function y = √x + k will shift the graph up if k is positive, and down if k is negative.
Examples:
y = √x + 4shifts the graph 4 units up.y = √x - 2shifts the graph 2 units down.
To graph these functions:
- Identify the value of
kin the function. - Shift the basic graph of
y = √xvertically bykunits.
For example, the graph of y = √x + 4 starts at the point (0, 4) instead of (0, 0).
Combining Horizontal and Vertical Shifts
When both horizontal and vertical shifts are present, such as in y = √(x - h) + k, apply both shifts to the basic graph of y = √x.
Example:
- Graph
y = √(x - 2) + 3:
- Identify
h = 2andk = 3. - Shift the graph of
y = √x2 units to the right and 3 units up.
The starting point of the graph will be (2, 3).
By understanding and applying these shifts, you can accurately graph any square root function and analyze how its shape changes with different values of h and k.
Reflections and Dilations
Reflections and dilations are essential transformations that affect the graph of a square root function. These transformations change the shape and orientation of the graph, helping to understand the function's behavior in different scenarios. The general form of a transformed square root function is:
y = a√(x - h) + k
Reflections
Reflections flip the graph of the function over a specific axis. There are two types of reflections:
- Reflection over the x-axis: This occurs when there is a negative sign in front of the square root function. The function
y = -√xreflects the graph ofy = √xover the x-axis. - Reflection over the y-axis: This occurs when the variable inside the square root is negated. The function
y = √(-x)reflects the graph ofy = √xover the y-axis.
Examples:
y = -√xreflects the graph ofy = √xover the x-axis.y = √(-x)reflects the graph ofy = √xover the y-axis.
To graph these functions:
- Identify the type of reflection (x-axis or y-axis).
- Flip the graph of the basic function
y = √xaccordingly.
Dilations
Dilations involve stretching or compressing the graph of the function. There are two types of dilations:
- Vertical dilation: This occurs when there is a coefficient
ain front of the square root. If|a| > 1, the graph is stretched vertically. If0 < |a| < 1, the graph is compressed vertically. - Horizontal dilation: Although less common in basic square root functions, horizontal dilation involves a coefficient inside the square root affecting the width of the graph.
Examples:
y = 2√xstretches the graph vertically by a factor of 2.y = 0.5√xcompresses the graph vertically by a factor of 0.5.
To graph these functions:
- Identify the dilation factor
a. - Stretch or compress the graph of the basic function
y = √xaccordingly.
Combining Reflections and Dilations
When both reflections and dilations are present, such as in y = -2√x, apply both transformations to the basic graph of y = √x.
Example:
- Graph
y = -2√x:
- Identify the reflection over the x-axis and the vertical stretch by a factor of 2.
- Reflect the graph of
y = √xover the x-axis. - Stretch the reflected graph vertically by a factor of 2.
By understanding and applying these transformations, you can accurately graph any square root function and analyze how its shape changes with different reflections and dilations.
Graphing Practice Problems
Practicing the graphing of square root functions helps solidify understanding and improve accuracy. Below are several practice problems, along with detailed steps to graph each function:
-
Graph the function: \( y = \sqrt{x - 1} \)
- Determine the domain: \( x - 1 \geq 0 \Rightarrow x \geq 1 \).
- Create a T-chart to find points:
x y 1 \(\sqrt{1 - 1} = 0\) 2 \(\sqrt{2 - 1} = 1\) 5 \(\sqrt{5 - 1} = 2\) - Plot the points (1,0), (2,1), and (5,2).
- Draw a smooth curve through the points.
-
Graph the function: \( y = -\sqrt{x + 3} \)
- Determine the domain: \( x + 3 \geq 0 \Rightarrow x \geq -3 \).
- Create a T-chart to find points:
x y -3 \(-\sqrt{-3 + 3} = 0\) 1 \(-\sqrt{1 + 3} = -2\) 6 \(-\sqrt{6 + 3} = -3\) - Plot the points (-3,0), (1,-2), and (6,-3).
- Draw a smooth curve through the points.
-
Graph the function: \( y = 2\sqrt{x - 4} + 1 \)
- Determine the domain: \( x - 4 \geq 0 \Rightarrow x \geq 4 \).
- Create a T-chart to find points:
x y 4 \(2\sqrt{4 - 4} + 1 = 1\) 5 \(2\sqrt{5 - 4} + 1 = 3\) 8 \(2\sqrt{8 - 4} + 1 = 5\) - Plot the points (4,1), (5,3), and (8,5).
- Draw a smooth curve through the points.
By following these steps, you will be able to accurately graph square root functions and understand their transformations. Remember to pay close attention to the domain and range, as well as the shape and direction of the graph.
Applications and Real-World Examples
Square root functions have numerous applications in various fields. Here are some real-world examples where square root functions are used:
Pendulum Period Calculation
One application is in calculating the period of a pendulum. The period \( T \) of a pendulum can be determined using the formula:
\[ T = 2\pi \sqrt{\frac{L}{g}} \]
where \( L \) is the length of the pendulum and \( g \) is the acceleration due to gravity. If a pendulum is lengthened, this affects the period as shown by the square root function.
Distance Between Points
Square roots are also used to find the distance between two points in a plane. The distance \( D \) between two points \((x_1, y_1)\) and \((x_2, y_2)\) is given by:
\[ D = \sqrt{(x_2 - x_1)^2 + (y_2 - y_1)^2} \]
This formula is derived from the Pythagorean Theorem and is essential in fields such as geography, computer graphics, and physics.
Quadratic Formula
The quadratic formula, used to find the solutions to a quadratic equation, also involves a square root. For the quadratic equation \( ax^2 + bx + c = 0 \), the solutions are given by:
\[ x = \frac{-b \pm \sqrt{b^2 - 4ac}}{2a} \]
This formula is crucial in mathematics and engineering for solving various types of problems involving quadratic relationships.
Structural Engineering
In structural engineering, square roots are used to calculate the lengths of supports in trusses. For example, the length of a diagonal support in a right triangle can be found using the Pythagorean Theorem, which involves a square root:
\[ c = \sqrt{a^2 + b^2} \]
where \( c \) is the length of the diagonal, and \( a \) and \( b \) are the lengths of the other two sides.
Financial Models
Square root functions are also found in financial models, such as those predicting profit growth over time. For instance, the annual profit \( P \) of a start-up company over time \( t \) might be modeled by:
\[ P(t) = k \sqrt{t - t_0} + C \]
where \( k \) and \( C \) are constants, and \( t_0 \) is the starting time.
These examples illustrate how square root functions are integral to various practical applications, from physics and engineering to finance and beyond.
Advanced Concepts: Cube Root Functions
Cube root functions, unlike square root functions, are defined for all real numbers. The parent function for cube root functions is:
\[ y = \sqrt[3]{x} \]
The graph of \( y = \sqrt[3]{x} \) passes through the origin and has an inflection point at \((0, 0)\), making it symmetrical about the origin. The domain and range of cube root functions are both all real numbers.
To understand the transformations of cube root functions, consider the general form:
\[ y = a \sqrt[3]{x - h} + k \]
Here, \(a\), \(h\), and \(k\) affect the graph as follows:
- Vertical Stretch/Compression: If \( |a| > 1 \), the graph stretches vertically. If \( 0 < |a| < 1 \), it compresses vertically.
- Horizontal Shift: The graph shifts horizontally by \(h\) units. If \(h\) is positive, the shift is to the right; if negative, to the left.
- Vertical Shift: The graph shifts vertically by \(k\) units. If \(k\) is positive, the shift is upward; if negative, downward.
- Reflection: If \(a\) is negative, the graph reflects across the x-axis.
Let's look at some examples:
- Graph \( y = \sqrt[3]{x} + 5 \):
- This represents a vertical shift of 5 units up.
![Graph of y = sqrt[3]{x} + 5](example1.png)
- Graph \( y = -\sqrt[3]{x + 2} - 3 \):
- Shift left by 2 units, down by 3 units, and reflect across the x-axis.
![Graph of y = -sqrt[3]{x + 2} - 3](example2.png)
- Graph \( y = \frac{1}{2} \sqrt[3]{x - 4} \):
- Shift right by 4 units and compress vertically by a factor of 1/2.
![Graph of y = 1/2 sqrt[3]{x - 4}](example3.png)
Understanding these transformations helps in graphing complex cube root functions and analyzing their behavior. Practice graphing different cube root functions to become familiar with these concepts.
Common Mistakes and Troubleshooting
When graphing square root functions, students often encounter several common mistakes and misconceptions. Understanding and addressing these issues can help improve accuracy and comprehension. Here are some key points to consider:
Common Mistakes
- Ignoring the Domain: The domain of a square root function must include only values for which the expression under the square root is non-negative. For example, in \( f(x) = \sqrt{x - 2} \), the domain is \( x \geq 2 \).
- Forgetting the Vertex: Many students neglect to identify and plot the vertex of the function first. For a function like \( f(x) = \sqrt{x - h} + k \), the vertex is at \( (h, k) \).
- Misinterpreting the Rate of Change: Unlike linear functions, the rate of change in a square root function is not constant. The graph starts off steep and becomes less steep as \( x \) increases.
- Overlooking Horizontal Shifts: When a function includes a horizontal shift, such as \( f(x) = \sqrt{x - h} \), some students fail to shift the graph correctly to the right or left by \( h \) units.
Troubleshooting Tips
- Check the Domain: Ensure that you only include values of \( x \) that make the expression inside the square root non-negative.
- Plot the Vertex: Identify the vertex of the function and plot it first. This will help guide the rest of your graph.
- Use Key Points: Choose several key points to plot. For \( f(x) = \sqrt{x} \), these might be \( (0, 0) \), \( (1, 1) \), \( (4, 2) \), and \( (9, 3) \). For transformations, adjust these points accordingly.
- Graph in Sections: Graph the function in sections if necessary, especially if it includes shifts or reflections. This can help manage more complex transformations.
Example Problem and Solution
Problem: Graph the function \( f(x) = 2\sqrt{x - 3} - 1 \).
- Determine the domain: \( x - 3 \geq 0 \) ⟹ \( x \geq 3 \).
- Identify the vertex: The vertex is at \( (3, -1) \).
- Plot key points: Start at the vertex and use points such as \( (4, 1) \) and \( (7, 3) \).
- Draw the curve: Connect the points smoothly, ensuring the graph reflects the transformation correctly.
By paying attention to these common mistakes and troubleshooting steps, students can improve their understanding and accuracy when graphing square root functions.
Interactive Tools and Resources
Utilizing interactive tools and resources can greatly enhance the understanding and visualization of graphing square root functions. Here are some recommended tools and activities:
-
Desmos Graphing Calculator
The is a powerful tool for visualizing square root functions. It allows you to graph functions, manipulate sliders to see transformations in real-time, and explore various properties of the functions interactively.
-
Khan Academy
offers comprehensive video tutorials and practice problems on graphing square root functions. These resources help reinforce the concepts through step-by-step explanations and interactive practice.
-
GeoGebra
is another excellent tool for graphing and exploring mathematical functions. It provides a dynamic geometry environment that is useful for visualizing and manipulating square root functions.
-
Interactive Worksheets
Websites like Teachers Pay Teachers offer interactive worksheets designed to help students practice graphing square root functions. These worksheets often include step-by-step instructions and guided practice problems.
-
Classroom Activities
Engage students with hands-on activities such as using graphing calculators or software in group projects. Activities can include exploring transformations, finding domain and range, and solving real-world problems using square root functions.
These tools and resources provide diverse ways to understand and practice graphing square root functions, catering to different learning styles and preferences.
Đồ Thị Hàm Số Căn Bậc Hai (bài tập thực hành)
READ MORE:
Alg1 10.1: Đồ Thị Hàm Số Căn Bậc Hai