Topic chi squared biology: The chi-squared test is a crucial statistical tool in biology used to determine if there is a significant difference between observed and expected data. This article explores its applications, calculations, and importance in various biological studies, from genetics to ecology, providing a comprehensive understanding for researchers and students alike.
Table of Content
- Chi-Squared Test in Biology
- Introduction to Chi-Squared Test
- Types of Chi-Squared Tests
- Applications in Biology
- Chi-Squared Test of Independence
- Chi-Squared Test of Goodness of Fit
- Calculation and Interpretation
- Examples of Biological Studies
- Chi-Squared Test in Genetics
- Chi-Squared Test in Ecology
- Chi-Squared Test in Medicine
- Limitations and Considerations
- YOUTUBE: Phân tích chi bình phương là một công cụ quan trọng trong nghiên cứu sinh học. Xem video này để hiểu rõ hơn về cách áp dụng phân tích chi bình phương trong nghiên cứu sinh học.
Chi-Squared Test in Biology
The chi-squared (χ²) test is a statistical method used to determine if there is a significant difference between the expected and observed frequencies in categorical datasets. This test is widely used in biological studies to analyze data and test hypotheses.
Applications of Chi-Squared Test
- Testing for genetic linkage
- Assessing the fit of observed data to theoretical models (goodness of fit)
- Determining independence between two categorical variables
Calculating Chi-Squared
To perform a chi-squared test, follow these steps:
- Collect the observed data and calculate the expected frequencies for each category.
- Use the formula: \[ \chi^2 = \sum \frac{(O_i - E_i)^2}{E_i} \] where \(O_i\) is the observed frequency and \(E_i\) is the expected frequency.
- Sum the calculated values for each category to get the chi-squared statistic.
Interpreting Chi-Squared Results
Compare the calculated chi-squared value to the critical value from the chi-squared distribution table, considering the degrees of freedom (df), which is calculated as:
\[
df = (number \, of \, rows - 1) \times (number \, of \, columns - 1)
\]
If the calculated value exceeds the critical value at a chosen significance level (commonly 0.05), the null hypothesis (no significant difference) is rejected, indicating a significant difference between the observed and expected frequencies.
Example
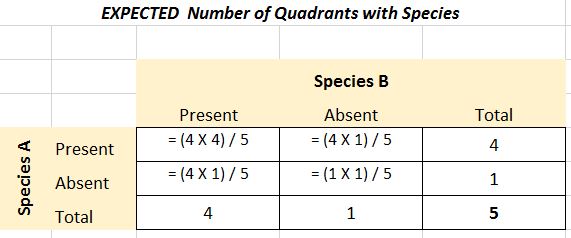
Consider a study testing whether two species of plants are distributed independently. Data collected in several quadrants can be organized into a contingency table, and the chi-squared test can determine if the observed distribution deviates significantly from the expected distribution.
| Species A Present | Species A Absent | |
| Species B Present | Observed: 20 | Observed: 30 |
| Species B Absent | Observed: 15 | Observed: 35 |
After calculating expected frequencies and applying the chi-squared formula, the results are analyzed against the critical value to determine if the species' distributions are independent.
Conclusion
The chi-squared test is a powerful tool in biological research for testing hypotheses about genetic linkage, population distributions, and other categorical data. Proper application and interpretation of the test can provide valuable insights into biological phenomena.

READ MORE:
Introduction to Chi-Squared Test
The Chi-Squared Test is a statistical method used to determine if there is a significant difference between the expected and observed frequencies in one or more categories. This test is particularly useful in biological research where scientists often need to test hypotheses about the distribution of categorical data.
There are two main types of Chi-Squared Tests: the Chi-Squared Test of Independence and the Chi-Squared Test of Goodness of Fit. The Test of Independence assesses whether two categorical variables are independent, while the Goodness of Fit test determines if a sample matches a population with a specific distribution.
To perform a Chi-Squared Test, follow these steps:
- Formulate the null hypothesis (H0) which states that there is no significant difference between the observed and expected data.
- Collect the observed data and calculate the expected data based on the hypothesis.
- Apply the Chi-Squared formula: \[ \chi^2 = \sum \frac{(O - E)^2}{E} \] where \(O\) represents the observed frequency and \(E\) represents the expected frequency.
- Determine the degrees of freedom (df), which is typically the number of categories minus one.
- Compare the calculated Chi-Squared value to the critical value from the Chi-Squared distribution table to determine the p-value.
The p-value indicates whether the observed differences are due to chance. If the p-value is less than the significance level (commonly 0.05), the null hypothesis is rejected, suggesting a significant difference between the observed and expected frequencies.
In biology, the Chi-Squared Test is widely used in genetics, ecology, and medicine. For example, it can help determine if a particular genotype distribution follows Mendelian inheritance patterns or if there is an association between two species in an ecosystem.
Types of Chi-Squared Tests
The chi-squared test is a versatile statistical tool used in various fields, including biology, to assess the relationship between categorical variables. There are two main types of chi-squared tests commonly used:
- Chi-Squared Test of Independence: This test evaluates whether there is a significant association between two categorical variables. It is used to determine if the distribution of one variable differs across the levels of another variable.
- Chi-Squared Test of Goodness of Fit: This test determines if a sample data matches a population with a specific distribution. It is used to see if observed sample frequencies differ significantly from expected frequencies under a certain hypothesis.
Both tests are essential in biological research for testing hypotheses and analyzing categorical data. Below are detailed descriptions of each type:
Chi-Squared Test of Independence
This test helps to determine if there is a relationship between two categorical variables. For instance, a biologist might use it to examine if the type of habitat (forest, grassland, wetland) is associated with the presence of a particular species. The test involves creating a contingency table to summarize the data and then calculating the chi-squared statistic to evaluate the independence of the variables.
- Formulate the Hypotheses:
- Null hypothesis (H0): The two variables are independent.
- Alternative hypothesis (H1): The two variables are not independent.
- Create a Contingency Table: Summarize the data in a matrix format, where rows represent one categorical variable and columns represent the other.
- Calculate Expected Frequencies: For each cell in the table, calculate the expected frequency under the assumption that the variables are independent.
- Compute the Chi-Squared Statistic: Use the formula:
\[
\chi^2 = \sum \frac{(O_i - E_i)^2}{E_i}
\]
where \( O_i \) is the observed frequency and \( E_i \) is the expected frequency. - Determine the Degrees of Freedom (df): Calculate using:
\[
df = (r - 1) \times (c - 1)
\]
where \( r \) is the number of rows and \( c \) is the number of columns. - Compare to the Chi-Squared Distribution: Compare the calculated chi-squared statistic to the critical value from the chi-squared distribution table at the desired significance level (e.g., 0.05).
- Draw a Conclusion: If the chi-squared statistic exceeds the critical value, reject the null hypothesis, indicating a significant association between the variables.
Chi-Squared Test of Goodness of Fit
This test is used to compare the observed distribution of a single categorical variable to a theoretical distribution. It is useful for testing if the distribution of observed frequencies matches expected frequencies in categories defined by a certain hypothesis. For example, a geneticist may use this test to see if the observed distribution of phenotypes follows the expected ratio based on Mendelian inheritance.
- Formulate the Hypotheses:
- Null hypothesis (H0): The observed data fits the expected distribution.
- Alternative hypothesis (H1): The observed data does not fit the expected distribution.
- Calculate Expected Frequencies: Based on the hypothesized distribution, calculate the expected frequency for each category.
- Compute the Chi-Squared Statistic: Use the same formula as for the test of independence:
\[
\chi^2 = \sum \frac{(O_i - E_i)^2}{E_i}
\]
where \( O_i \) is the observed frequency and \( E_i \) is the expected frequency. - Determine the Degrees of Freedom (df): Calculate using:
\[
df = n - 1
\]
where \( n \) is the number of categories. - Compare to the Chi-Squared Distribution: Compare the calculated chi-squared statistic to the critical value from the chi-squared distribution table at the desired significance level.
- Draw a Conclusion: If the chi-squared statistic exceeds the critical value, reject the null hypothesis, indicating that the observed distribution does not match the expected distribution.
Applications in Biology
The Chi-Squared Test is a powerful statistical tool widely used in various fields of biology to analyze the association between categorical variables. Here are some key applications of the Chi-Squared Test in biology:
- Genetics: In genetics, the Chi-Squared Test is used to determine if the observed genetic variation in a population deviates significantly from the expected variation under a specific genetic hypothesis. For example, it can be used to test the hypothesis that genes are independently assorted during gamete formation.
- Ecology: In ecological studies, the Chi-Squared Test is often used to analyze the distribution of species in different habitats. It helps ecologists determine if there is a significant association between species and environmental factors or between different species within the same habitat.
- Medicine: In medical research, the Chi-Squared Test can be used to examine the relationship between different medical conditions and potential risk factors. For example, it can help determine if there is an association between a particular genotype and a disease.
- Behavioral Studies: In studies of animal behavior, the Chi-Squared Test can be applied to investigate if there is a significant relationship between behavioral traits and environmental conditions or social structures.
These applications demonstrate the versatility of the Chi-Squared Test in addressing various biological questions. By comparing observed data with expected outcomes, biologists can infer patterns and relationships that are critical for understanding the complexities of life.
Chi-Squared Test of Independence
The Chi-Squared Test of Independence is a statistical method used to determine if there is a significant association between two categorical variables. This test evaluates whether the observed frequency distribution of a dataset differs from the expected distribution if the variables were independent.
The steps to perform a Chi-Squared Test of Independence are as follows:
-
State the Hypotheses:
- Null Hypothesis (\(H_0\)): The two variables are independent.
- Alternative Hypothesis (\(H_1\)): The two variables are not independent.
-
Create a Contingency Table:
Construct a table to display the frequency distribution of the variables.
Category 1 Category 2 Total Group 1 Observed (O11) Observed (O12) Row Total Group 2 Observed (O21) Observed (O22) Row Total Column Total Column Total Column Total Grand Total -
Calculate Expected Values:
Use the formula \(E = \frac{(\text{Row Total} \times \text{Column Total})}{\text{Grand Total}}\) to calculate the expected frequency for each cell in the table.
Category 1 Category 2 Group 1 Expected (E11) Expected (E12) Group 2 Expected (E21) Expected (E22) -
Compute the Chi-Squared Statistic:
Use the formula \(\chi^2 = \sum \frac{(O - E)^2}{E}\) where \(O\) is the observed frequency and \(E\) is the expected frequency.
-
Determine the Degrees of Freedom:
Calculate the degrees of freedom using \((r - 1) \times (c - 1)\), where \(r\) is the number of rows and \(c\) is the number of columns in the contingency table.
-
Find the P-Value:
Using the chi-squared statistic and the degrees of freedom, find the p-value from the chi-squared distribution table.
-
Make a Decision:
If the p-value is less than the chosen significance level (typically 0.05), reject the null hypothesis. This indicates that there is a significant association between the two variables.
The Chi-Squared Test of Independence is widely used in biological studies to test relationships between categorical variables, such as genetic traits and phenotypes, disease occurrence and risk factors, and more.
Chi-Squared Test of Goodness of Fit
The Chi-Squared Test of Goodness of Fit is used to determine whether the observed frequency distribution of a categorical variable matches an expected distribution. This test is commonly used in biological studies to compare observed data with data expected based on a particular hypothesis.
Hypotheses
The test involves the following hypotheses:
- Null Hypothesis (H0): The observed data follows the expected distribution.
- Alternative Hypothesis (H1): The observed data does not follow the expected distribution.
Formula
The test statistic is calculated using the formula:
\[ \chi^2 = \sum \frac{(O - E)^2}{E} \]
- O: Observed frequency
- E: Expected frequency
- Σ: Sum across all categories
Steps to Perform the Test
- Calculate the expected frequencies (E): Determine the expected frequency for each category based on the null hypothesis.
- Compute the chi-squared statistic (χ2): Use the formula to calculate the test statistic.
- Determine the degrees of freedom (df): The degrees of freedom for the test is the number of categories minus one (n - 1).
- Find the p-value: Compare the test statistic to a chi-squared distribution with the appropriate degrees of freedom to find the p-value.
- Make a decision: If the p-value is less than the significance level (commonly 0.05), reject the null hypothesis.
Example
Consider a genetics study where researchers want to test if the distribution of flower colors in a population of plants fits an expected ratio of 9:3:3:1 (based on Mendelian inheritance).
| Color | Observed (O) | Expected (E) | (O - E)2 / E |
|---|---|---|---|
| Red | 90 | 100 | 1.0 |
| White | 30 | 33.33 | 0.333 |
| Pink | 25 | 33.33 | 2.083 |
| Yellow | 5 | 11.11 | 3.361 |
The chi-squared statistic is calculated as:
\[ \chi^2 = 1.0 + 0.333 + 2.083 + 3.361 = 6.777 \]
With 3 degrees of freedom (4 categories - 1), you would compare the test statistic to the critical value from the chi-squared distribution table or use software to find the p-value. If the p-value is less than 0.05, you reject the null hypothesis and conclude that the observed distribution does not fit the expected ratio.
Applications
The Chi-Squared Test of Goodness of Fit is widely used in biology to test hypotheses about genetic distributions, population sampling, ecological surveys, and other scenarios where expected frequency distributions are known.
Calculation and Interpretation
The chi-squared test involves a few key steps in both calculation and interpretation. Here's a detailed guide:
-
Formulate Hypotheses
Start by stating the null hypothesis (\(H_0\)) and the alternative hypothesis (\(H_A\)). For example:
- Null Hypothesis (\(H_0\)): The observed data fits the expected distribution.
- Alternative Hypothesis (\(H_A\)): The observed data does not fit the expected distribution.
-
Calculate Expected Frequencies
For each category, calculate the expected frequency based on the null hypothesis. If the expected frequency for a category is less than 5, consider combining it with another category.
The formula for expected frequency (\(E\)) is:
\[ E = \frac{\text{Total Observations} \times \text{Proportion for Each Category}}{\text{Total Categories}} \]
-
Compute the Chi-Squared Statistic
The chi-squared statistic (\(X^2\)) is calculated using the formula:
\[ X^2 = \sum \frac{(O - E)^2}{E} \]
Where:
- \(O\) = Observed frequency
- \(E\) = Expected frequency
Summing these values across all categories gives the chi-squared statistic.
-
Determine Degrees of Freedom
The degrees of freedom (df) for the chi-squared test is calculated as:
\[ \text{df} = \text{Number of Categories} - 1 \]
-
Compare to Critical Value
Using a chi-squared distribution table, find the critical value for the calculated degrees of freedom at the desired significance level (e.g., 0.05). If the chi-squared statistic is greater than the critical value, reject the null hypothesis.
Here's an example to illustrate the process:
| Category | Observed (O) | Expected (E) | (O - E) | (O - E)2 | (O - E)2 / E |
|---|---|---|---|---|---|
| Category 1 | 15 | 10 | 5 | 25 | 2.5 |
| Category 2 | 30 | 25 | 5 | 25 | 1 |
| Category 3 | 20 | 30 | -10 | 100 | 3.33 |
| Total Chi-Squared | 6.83 | ||||
If the critical value from the chi-squared table for 2 degrees of freedom at 0.05 significance is 5.99, and our calculated value (6.83) exceeds this, we reject the null hypothesis, indicating a significant difference between observed and expected frequencies.
Interpreting the chi-squared test results involves understanding the context of the data and the implications of either rejecting or failing to reject the null hypothesis. Always ensure the sample size and expected frequencies meet the assumptions of the test for valid results.
Examples of Biological Studies
The Chi-Squared test is widely used in biology to analyze the association between categorical variables. Here are some examples of its application in various biological studies:
1. Genetics
The Chi-Squared test is frequently used in genetics to determine whether the observed genetic variation in a population conforms to expected distributions.
- Mendelian Inheritance: Gregor Mendel's experiments with pea plants are a classic example. The Chi-Squared test can be used to analyze the distribution of phenotypes to confirm if they align with Mendel's laws of inheritance.
- Hardy-Weinberg Equilibrium: In population genetics, the test can determine if a population's genetic makeup is in equilibrium, indicating that no evolutionary forces are acting on it.
2. Ecology
In ecology, the Chi-Squared test is useful for understanding species distribution and the interactions between species.
- Species Abundance: Researchers can use the test to analyze whether the distribution of species across different habitats is random or influenced by specific environmental factors.
- Habitat Preference: By comparing the observed and expected frequencies of species in various habitats, ecologists can infer habitat preferences and behaviors.
3. Medicine
In medical research, the Chi-Squared test is instrumental in studying the association between different health conditions and risk factors.
- Disease Association Studies: The test can help identify if certain genetic markers are associated with diseases, aiding in the understanding of genetic predispositions.
- Treatment Efficacy: It can compare the effectiveness of different treatments by analyzing the frequencies of outcomes in clinical trials.
4. Developmental Biology
The Chi-Squared test can be applied to study developmental processes and anomalies.
- Embryonic Development: Researchers might use the test to compare the observed frequencies of developmental stages or anomalies in different experimental conditions to expected ratios.
5. Microbiology
In microbiology, the Chi-Squared test helps analyze the distribution and behavior of microorganisms.
- Antibiotic Resistance: It can determine if the resistance patterns of bacteria in a population differ from expected patterns, indicating potential resistance mechanisms.
- Microbial Diversity: The test can be used to compare the diversity of microbial communities across different environments or treatments.
Example Calculation
To illustrate the use of the Chi-Squared test in biology, consider a study on the distribution of blood types in a population:
| Blood Type | Observed Frequency | Expected Frequency |
|---|---|---|
| A | 40 | 45 |
| B | 30 | 25 |
| AB | 20 | 15 |
| O | 10 | 15 |
The Chi-Squared statistic is calculated using the formula:
Where \( O \) represents the observed frequency and \( E \) represents the expected frequency. The calculated Chi-Squared value can then be compared to a critical value from the Chi-Squared distribution table to determine the statistical significance.
Chi-Squared Test in Genetics
The Chi-Squared test is a powerful tool in genetics for testing the relationship between observed and expected frequencies of genetic traits. It helps in validating genetic models and understanding the inheritance patterns. Here are detailed steps and examples of its application:
1. Mendelian Inheritance
One of the classic applications of the Chi-Squared test in genetics is to verify Mendelian inheritance patterns. For instance, consider a monohybrid cross where we expect a 3:1 ratio of dominant to recessive traits in the offspring.
| Phenotype | Observed Frequency (O) | Expected Frequency (E) |
|---|---|---|
| Dominant | 75 | 80 |
| Recessive | 25 | 20 |
The Chi-Squared statistic is calculated using the formula:
Substituting the values:
Calculating these terms gives:
Comparing this Chi-Squared value to the critical value from the Chi-Squared distribution table (with 1 degree of freedom and a significance level of 0.05, the critical value is 3.841), we see that 1.5625 < 3.841. Hence, we fail to reject the null hypothesis and conclude that the observed ratio fits the expected Mendelian ratio.
2. Hardy-Weinberg Equilibrium
The Chi-Squared test is also used to test whether a population is in Hardy-Weinberg equilibrium, which implies no evolutionary forces are acting on the population. Consider a population where we are examining a single gene with two alleles: A and a.
Let the observed genotype frequencies be as follows:
| Genotype | Observed Frequency (O) | Expected Frequency (E) |
|---|---|---|
| AA | 50 | 45 |
| Aa | 30 | 40 |
| aa | 20 | 15 |
The Chi-Squared statistic is calculated as:
Calculating these terms gives:
Comparing this Chi-Squared value to the critical value from the Chi-Squared distribution table (with 2 degrees of freedom and a significance level of 0.05, the critical value is 5.991), we see that 4.7223 < 5.991. Hence, we fail to reject the null hypothesis and conclude that the population is in Hardy-Weinberg equilibrium.
These examples demonstrate how the Chi-Squared test is essential in validating genetic hypotheses and understanding the genetic structure of populations.

Chi-Squared Test in Ecology
The Chi-Squared test is a valuable tool in ecology for analyzing categorical data and understanding patterns in species distribution, habitat preferences, and interactions within ecosystems. Here are some detailed examples of its application:
1. Species Distribution
The Chi-Squared test can determine if the distribution of species across different habitats deviates from what would be expected by chance.
Consider a study examining the presence of a particular plant species in four different types of habitats. The observed and expected frequencies are shown in the table below:
| Habitat Type | Observed Frequency (O) | Expected Frequency (E) |
|---|---|---|
| Forest | 20 | 25 |
| Grassland | 30 | 25 |
| Wetland | 25 | 25 |
| Desert | 15 | 15 |
The Chi-Squared statistic is calculated using the formula:
Substituting the values:
Calculating these terms gives:
Comparing this Chi-Squared value to the critical value from the Chi-Squared distribution table (with 3 degrees of freedom and a significance level of 0.05, the critical value is 7.815), we see that 2 < 7.815. Hence, we fail to reject the null hypothesis and conclude that the observed species distribution is consistent with the expected distribution.
2. Habitat Preference
Another application is in studying habitat preferences. Ecologists can use the Chi-Squared test to determine if certain species prefer specific habitats more than others.
Consider a study on bird species in different types of habitats with the following data:
| Habitat Type | Observed Frequency (O) | Expected Frequency (E) |
|---|---|---|
| Forest | 50 | 40 |
| Grassland | 30 | 40 |
| Wetland | 10 | 10 |
| Urban | 10 | 10 |
The Chi-Squared statistic is calculated as follows:
Calculating these terms gives:
Comparing this Chi-Squared value to the critical value from the Chi-Squared distribution table (with 3 degrees of freedom and a significance level of 0.05, the critical value is 7.815), we see that 5 < 7.815. Hence, we fail to reject the null hypothesis and conclude that the observed habitat preferences of the bird species are consistent with the expected preferences.
These examples highlight the utility of the Chi-Squared test in analyzing ecological data, helping ecologists draw meaningful conclusions about species distribution and habitat preferences.
Chi-Squared Test in Medicine
The Chi-Squared test is widely utilized in medicine to analyze categorical data and assess the significance of relationships between variables. Here are some key applications:
- Epidemiological Studies: Researchers use Chi-Squared tests to evaluate associations between exposure to risk factors (like smoking or diet) and the incidence of diseases (such as cancer or cardiovascular diseases).
- Clinical Trials: It helps in determining if there is a significant difference in outcomes between treatment groups or to compare the effectiveness of different therapies.
- Genetic Studies: Chi-Squared tests are applied to genetic data to examine deviations from expected genotype frequencies in populations, which is crucial in understanding inheritance patterns and disease susceptibility.
- Disease Clustering: In epidemiology, Chi-Squared tests are used to investigate whether the occurrence of a disease in a particular area or population significantly differs from what would be expected.
These applications highlight the versatility of the Chi-Squared test in medical research, offering valuable insights into disease etiology, treatment efficacy, and public health interventions.
Limitations and Considerations
While the Chi-Squared test is a powerful tool, there are several limitations and considerations to keep in mind:
- Sample Size: Small sample sizes can lead to unreliable results, as Chi-Squared tests require an adequate number of observations in each category.
- Assumption of Independence: The test assumes that observations are independent, which may not always hold true in real-world data.
- Validity of Expected Frequencies: Results can be skewed if expected frequencies are not accurately estimated or if assumptions about the distribution of data are violated.
- Cell Frequencies: The test may produce inaccurate results when cell frequencies are very low, often requiring larger sample sizes or alternative statistical methods.
- Interpretation of Results: While Chi-Squared tests indicate statistical significance, they do not provide information about the strength or direction of relationships between variables.
Considering these factors is essential for appropriately applying the Chi-Squared test and interpreting results accurately in biological research and other fields.
Phân tích chi bình phương là một công cụ quan trọng trong nghiên cứu sinh học. Xem video này để hiểu rõ hơn về cách áp dụng phân tích chi bình phương trong nghiên cứu sinh học.
Phân tích chi bình phương - Bài giảng sinh học (Trình độ A Level, Pre-U, IB, AP Bio)
READ MORE:
Xem video về phân tích chi bình phương để hiểu thêm về cách áp dụng phương pháp này trong nghiên cứu sinh học.
Phân tích chi bình phương trong sinh học
:max_bytes(150000):strip_icc()/Chi-SquareStatistic_Final_4199464-7eebcd71a4bf4d9ca1a88d278845e674.jpg)