Topic chi square value calculator: Discover how a Chi Square Value Calculator can simplify your statistical analysis by determining the significance of observed versus expected frequencies in categorical data. Learn about its types, applications, and step-by-step instructions to make informed decisions with ease. Perfect for researchers, students, and professionals seeking accurate and quick results.
Table of Content
Chi-Square Value Calculator
A chi-square value calculator is a useful tool for performing chi-square tests, which are widely used in statistics to determine if there is a significant association between categorical variables. Below is a detailed description of how to use a chi-square value calculator, along with some essential concepts and examples.
How to Use a Chi-Square Calculator
- Enter the observed frequencies for each category in a contingency table format.
- Input the expected frequencies if they are known, or use the calculator to estimate them based on the hypothesis.
- Click "Calculate" to obtain the chi-square value, degrees of freedom, and p-value.
Chi-Square Formula
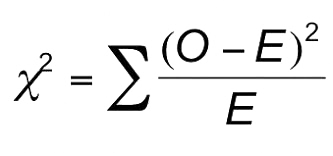
The chi-square statistic is calculated using the formula:
\[
\chi^2 = \sum \frac{(O_i - E_i)^2}{E_i}
\]
where \(O_i\) represents the observed frequency and \(E_i\) represents the expected frequency.
Example Calculation
Consider an example where you want to test whether gender and final exam scores are independent. The observed frequencies are as follows:
| Score | Girls | Boys |
|---|---|---|
| A | 5 | 6 |
| A- | 7 | 8 |
| B | 8 | 7 |
| B- | 6 | 5 |
To determine if there is a significant association between gender and exam scores, input these frequencies into the chi-square calculator. The output might be a chi-square value of 0.3152 with 3 degrees of freedom, and a p-value of 0.9572. Since the p-value is greater than 0.05, we cannot reject the null hypothesis, indicating that gender and exam scores are independent.
Assumptions and Conditions
- The data should be in the form of frequencies or counts of cases.
- The categories should be mutually exclusive.
- The expected frequency in each cell should be at least 5 for the approximation to be reliable.
Types of Chi-Square Tests
- Chi-Square Test for Independence: Used to determine if there is a significant association between two categorical variables.
- Chi-Square Goodness of Fit Test: Used to determine if a sample data matches an expected distribution.
Resources and Tools
Using these tools can simplify the process of performing chi-square tests and help in making informed decisions based on statistical data.

READ MORE:
Introduction
The chi-square value calculator is a versatile tool used in statistical analysis to determine the significance of observed data compared to expected data. It is commonly used for hypothesis testing, particularly in chi-square tests of independence and goodness of fit. These tests help researchers understand if there is a significant association between categorical variables or if observed data fits a theoretical distribution.
The calculator typically requires input of observed frequencies and expected frequencies, and it computes the chi-square statistic, degrees of freedom, and the p-value. This allows users to interpret whether their observed data significantly deviates from the expected data, helping to confirm or refute hypotheses about the relationships between variables.
Chi-square tests are widely used in various fields including biology, marketing, social sciences, and engineering. They provide a straightforward method to analyze categorical data, making it easier to draw meaningful conclusions from research studies.
Understanding Chi-Square Test
The chi-square test is a statistical method used to determine if there is a significant association between categorical variables. It is widely used in hypothesis testing to examine the relationship between observed and expected frequencies in a contingency table. The chi-square test can be applied in various fields such as biology, psychology, and marketing to test the independence of variables or the goodness of fit of observed data to a theoretical distribution.
Types of Chi-Square Tests
- Chi-Square Goodness of Fit Test
- Chi-Square Test of Independence
- Chi-Square Test of Homogeneity
- McNemar's Test
Steps to Perform a Chi-Square Test
- State the hypotheses:
- Null Hypothesis (H0): Assumes no significant difference or association between the variables.
- Alternative Hypothesis (HA): Assumes a significant difference or association between the variables.
- Calculate the expected frequencies for each category based on the null hypothesis.
- Compute the chi-square statistic using the formula:
\[\chi^2 = \sum \frac{(O_i - E_i)^2}{E_i}\]
where \(O_i\) is the observed frequency and \(E_i\) is the expected frequency. - Determine the degrees of freedom (df) using the formula:
\[df = (r - 1) \times (c - 1)\]
where \(r\) is the number of rows and \(c\) is the number of columns in the contingency table. - Compare the chi-square statistic to the critical value from the chi-square distribution table at a chosen significance level (e.g., 0.05) to determine whether to reject the null hypothesis.
Applications of Chi-Square Test
- Testing the independence of attributes in a contingency table.
- Assessing the goodness of fit between observed and expected frequencies.
- Analyzing survey data to determine if responses differ significantly from expected values.
- Evaluating the distribution of categorical variables in experimental research.
Steps to Calculate Chi-Square Value
Calculating the chi-square value involves several key steps to ensure accurate results. Follow these steps to perform a chi-square test effectively:
-
Define Hypotheses: Start by defining the null hypothesis (H0) and the alternative hypothesis (HA). The null hypothesis states that there is no significant difference between the observed and expected frequencies, while the alternative hypothesis suggests a significant difference.
-
Collect Data: Gather the observed frequencies from your data set. These frequencies represent the actual counts observed in each category.
-
Calculate Expected Frequencies: Determine the expected frequencies based on the null hypothesis. The expected frequency for each category can be calculated using the formula:
\[
E_i = \frac{(row \ total \times column \ total)}{grand \ total}
\] -
Compute Chi-Square Statistic: Use the observed (Oi) and expected (Ei) frequencies to calculate the chi-square statistic with the formula:
\[
\chi^2 = \sum \frac{(O_i - E_i)^2}{E_i}
\] -
Determine Degrees of Freedom: The degrees of freedom (df) are calculated based on the number of categories in the data. For a chi-square test, the formula is:
\[
df = (number \ of \ rows - 1) \times (number \ of \ columns - 1)
\] -
Find the P-Value: Use a chi-square distribution table or calculator to find the p-value corresponding to the chi-square statistic and degrees of freedom. The p-value helps determine the statistical significance of the test results.
-
Interpret Results: Compare the p-value to your significance level (usually 0.05). If the p-value is less than the significance level, reject the null hypothesis, indicating a significant difference between the observed and expected frequencies.
By following these steps, you can accurately calculate the chi-square value and determine the significance of your data.
Using Online Chi-Square Calculators
Online chi-square calculators are convenient tools that allow you to compute chi-square values quickly and accurately. These calculators often come with step-by-step instructions, making them accessible to both beginners and professionals. Here's a detailed guide on using these online tools:
Step-by-Step Guide
- Choose a Calculator: Select an online chi-square calculator from a reliable website. Some popular options include:
- Input Data: Enter the observed frequencies into the calculator. This typically involves filling in a contingency table with your data. Ensure that you input the data correctly to obtain accurate results.
- Calculate Expected Frequencies: Many calculators will automatically compute the expected frequencies based on your input. If not, you may need to calculate them manually using the formula:
\[ E_i = \frac{(Row \ Total \times Column \ Total)}{Grand \ Total} \]
- Compute the Chi-Square Statistic: The calculator will use the observed and expected frequencies to compute the chi-square statistic using the formula:
\[\chi^2 = \sum \frac{(O_i - E_i)^2}{E_i}\]
- Interpret the Results: The calculator will provide you with the chi-square value and the corresponding p-value. Compare the p-value with your significance level (commonly 0.05) to determine if the result is statistically significant. If the p-value is less than the significance level, you reject the null hypothesis, indicating a significant association between the variables.
Features of Online Calculators
Most online chi-square calculators come with various features to enhance user experience:
- User-Friendly Interface: Simple and intuitive design to facilitate easy data entry and interpretation of results.
- Step-by-Step Guidance: Detailed instructions and prompts to help users navigate through the calculation process.
- Visualization Tools: Some calculators offer visual representations of data, such as charts and graphs, to aid in understanding the results.
- Export Options: Ability to export results and data tables for further analysis or reporting purposes.
- Educational Resources: Access to additional learning materials, tutorials, and examples to help users understand the chi-square test better.
Utilizing these online calculators can significantly streamline the process of performing chi-square tests, making statistical analysis more accessible and efficient for everyone from students to seasoned researchers.
Frequently Asked Questions (FAQs)
-
What is a Chi-Square Test?
A Chi-Square Test is a statistical method used to analyze the relationship between two categorical variables, determining whether they have a significant association or are independent. It is widely used in fields such as marketing, healthcare, and education.
-
How is the Chi-Square statistic calculated?
The Chi-Square statistic is calculated by summing the squared difference between observed and expected frequencies, divided by the expected frequencies for each category. The formula is:
\[\chi^2 = \sum \frac{(O_i - E_i)^2}{E_i}\]
- \(O_i\) = Observed frequency
- \(E_i\) = Expected frequency
-
What does the p-value in a Chi-Square Test indicate?
The p-value helps determine the significance of the results. A p-value less than 0.05 suggests that the observed association is statistically significant and not due to random chance.
-
Can the Chi-Square Test be used for large datasets?
Yes, the Chi-Square Test can be applied to large datasets. However, it is crucial to ensure that the expected frequencies in each cell of the contingency table are sufficient (usually at least 5) to maintain the validity of the test.
-
What are the degrees of freedom in a Chi-Square Test?
Degrees of freedom in a Chi-Square Test typically equal the number of categories in each variable minus one, multiplied together. For a 2×2 table, this would be \((2-1) \times (2-1) = 1\).
-
How does sample size affect a Chi-Square Test?
The sample size can significantly impact the Chi-Square Test. Larger sample sizes can provide more reliable results, but it is important that expected frequencies are not too low to ensure the validity of the test.
Examples and Practical Applications
Chi-square tests are widely used in various fields to determine the relationship between categorical variables. Here, we explore some practical applications and examples to illustrate their utility.
Example 1: Chi-Square Test for Independence
Imagine a researcher wants to investigate whether gender (male or female) affects the choice of a major (science or humanities) among university students. The data collected from a sample of 300 students is summarized in a contingency table:
| Science | Humanities | Total | |
|---|---|---|---|
| Male | 90 | 30 | 120 |
| Female | 60 | 120 | 180 |
| Total | 150 | 150 | 300 |
The chi-square test will determine if there is a significant association between gender and choice of major. The steps are as follows:
- Calculate the expected frequencies for each cell of the table.
- Use the formula \[\chi^2 = \sum \frac{(O_i - E_i)^2}{E_i}\] to compute the chi-square statistic, where \(O_i\) is the observed frequency and \(E_i\) is the expected frequency.
- Compare the calculated chi-square value to the critical value from the chi-square distribution table with the appropriate degrees of freedom.
Example 2: Chi-Square Goodness of Fit Test
The chi-square goodness of fit test can be used to determine if a sample follows a specific distribution, such as the Poisson distribution. For instance, a safety inspector monitors car accidents at a busy intersection over 50 months and wants to check if the accident counts follow a Poisson distribution.
The hypotheses for this test are:
- Null: The sample data follow the Poisson distribution.
- Alternative: The sample data do not follow the Poisson distribution.
The steps to perform this test include:
- Calculate the expected frequencies based on the Poisson distribution.
- Compute the chi-square statistic using the observed and expected frequencies.
- Compare the chi-square statistic to the critical value to determine if the observed distribution fits the expected Poisson distribution.
Practical Application: Market Research
Chi-square tests are extensively used in market research to analyze consumer preferences. For example, a company might use a chi-square test to determine if the preference for a product is independent of age groups. By collecting data from various age groups and product preferences, the company can use the chi-square test to make informed marketing decisions.
Conclusion
These examples demonstrate the versatility of chi-square tests in analyzing categorical data across different fields. Whether testing for independence or goodness of fit, chi-square tests provide a robust statistical tool for researchers and analysts to derive meaningful insights from their data.
Conclusion
The chi-square test is a versatile and powerful statistical tool for analyzing categorical data. By comparing observed and expected frequencies, it helps researchers determine whether there are significant associations between variables or if the observed differences are due to chance.
Using a chi-square value calculator simplifies the computation process, making it accessible to users from various fields such as research, medicine, and social sciences. These online tools not only provide quick and accurate results but also offer step-by-step guidance through the calculations.
Chi-square tests, including the test of independence and goodness of fit, are essential for hypothesis testing. They enable us to test the relationships between categorical variables and make informed decisions based on statistical evidence. Additionally, Yates' correction for continuity can be applied to improve the accuracy of the chi-square test in certain conditions.
In conclusion, chi-square tests are crucial for examining categorical data. Utilizing online calculators enhances the ease and accuracy of these tests, ensuring that researchers, students, and professionals can effectively analyze their data and draw meaningful conclusions.
Cách Thực Hiện Kiểm Định Chi-Square (Bằng Tay)
READ MORE:
Thực Hiện Kiểm Định Chi-Square Độc Lập Trong Excel (Bao Gồm Giá Trị P!)


:max_bytes(150000):strip_icc()/Chi-SquareStatistic_Final_4199464-7eebcd71a4bf4d9ca1a88d278845e674.jpg)