Topic x squared test statistic: The x squared test statistic, commonly known as the chi-squared test, is a fundamental tool in statistical hypothesis testing. It helps determine if there is a significant association between categorical variables. This article delves into the principles, formulas, and applications of the chi-squared test, providing clear examples and practical guidance for accurate implementation.
Table of Content
- Chi-Square Test Statistic
- Conclusion
- Conclusion
- Introduction
- What is a Chi-Squared Test Statistic?
- Types of Chi-Squared Tests
- Formulas and Calculations
- Applications of Chi-Squared Tests
- Assumptions and Conditions
- Interpreting Chi-Squared Test Results
- Common Issues and Solutions
- Advantages and Disadvantages
- Examples in Software
- Advanced Topics
- Further Reading and Resources
- YOUTUBE:
Chi-Square Test Statistic
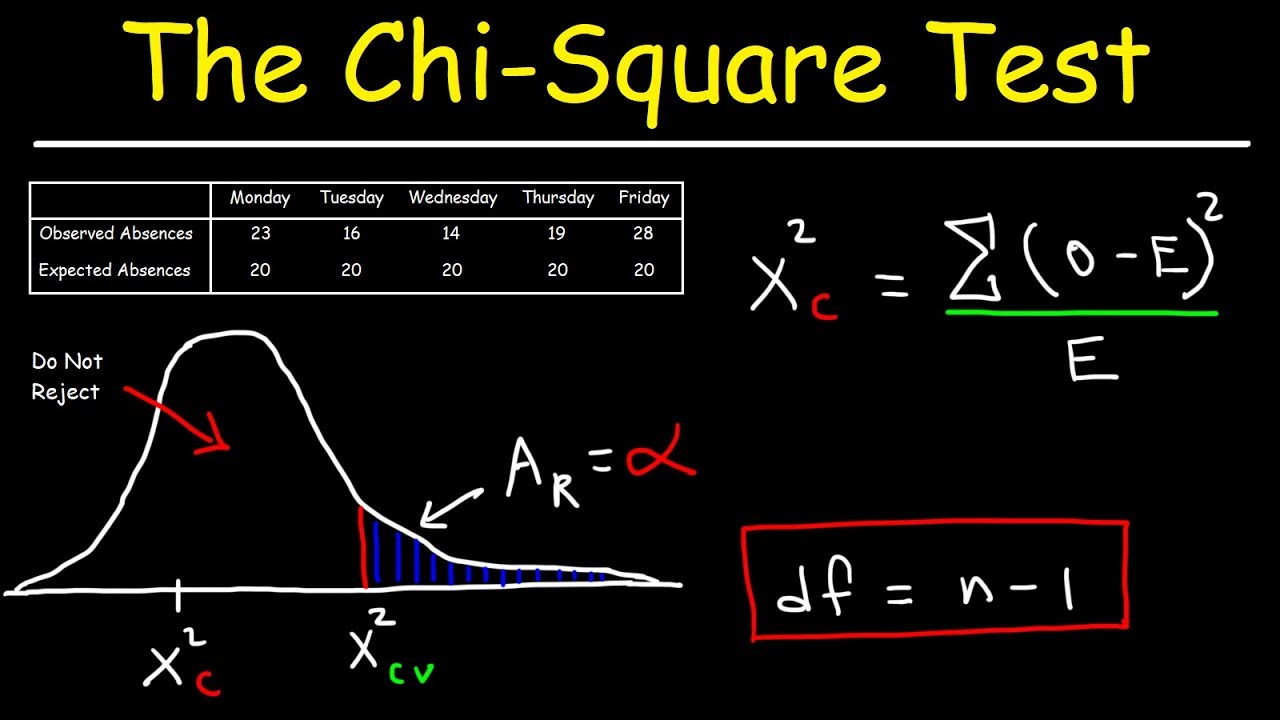
The Chi-Square test statistic is calculated using the formula:
\[
\chi^2 = \sum \frac{(O_i - E_i)^2}{E_i}
\]
where:
- \(O_i\) = observed frequency
- \(E_i\) = expected frequency
Applications of Chi-Square Test
The Chi-Square test is used in various contexts, including:
- Testing the independence of two categorical variables (Chi-Square Test of Independence)
- Testing the goodness of fit of an observed distribution to a theoretical one (Chi-Square Goodness of Fit Test)
- Assessing the variance of a normally distributed population
Example of Chi-Square Test for Independence
Consider a city of 1,000,000 residents with four neighborhoods: A, B, C, and D. A random sample of 650 residents is taken, and their occupations are recorded as "white collar", "blue collar", or "no collar". The null hypothesis is that occupation is independent of neighborhood.
| A | B | C | D | Total | |
| White collar | 90 | 60 | 104 | 95 | 349 |
| Blue collar | 30 | 50 | 51 | 20 | 151 |
| No collar | 30 | 40 | 45 | 35 | 150 |
| Total | 150 | 150 | 200 | 150 | 650 |
Using the Chi-Square formula, the test statistic can be calculated to determine if there is a significant relationship between occupation and neighborhood.
Properties of the Chi-Square Distribution
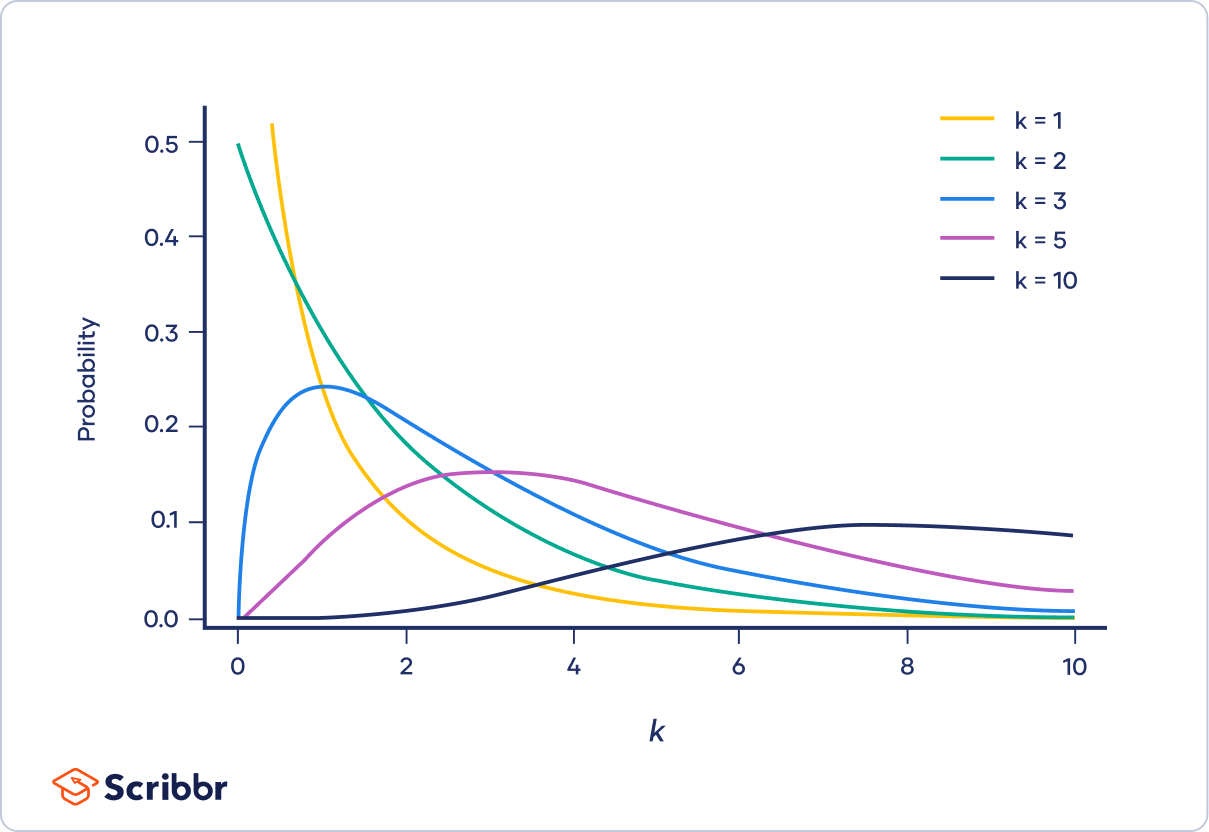
The Chi-Square distribution is defined by its degrees of freedom (df), which typically equals the number of categories minus one. The distribution is right-skewed, but becomes more symmetrical as the degrees of freedom increase.
For example, if you have a sample size of 21 from a normal distribution, the Chi-Square distribution for variance testing will have 20 degrees of freedom. The acceptance region for the test statistic at a 5% significance level ranges between 9.59 and 34.17.
:max_bytes(150000):strip_icc()/Chi-SquareStatistic_Final_4199464-7eebcd71a4bf4d9ca1a88d278845e674.jpg)
READ MORE:
Conclusion
The Chi-Square test is a robust statistical tool used to examine the relationship between categorical variables and to test the goodness of fit for distributions. Understanding how to calculate and interpret the Chi-Square test statistic is essential for conducting effective hypothesis tests in various fields of research.
Introduction
The chi-square (\( \chi^2 \)) test statistic is a fundamental tool in statistical analysis used to test hypotheses about the distribution of categorical variables. This test helps determine if there is a significant association between observed frequencies and expected frequencies in one or more categories. Widely applied in research fields such as biology, social sciences, and economics, the chi-square test evaluates the goodness of fit and tests for independence.
The key idea behind the chi-square test is to compare the observed data with the data we would expect to obtain according to a specific hypothesis. The resulting chi-square statistic quantifies the extent of the difference between observed and expected data, considering the sample size and the degrees of freedom involved.
There are two main types of chi-square tests:
- Chi-Square Test of Independence: This test assesses whether two categorical variables are independent or related. For instance, it can evaluate if gender is related to voting preferences.
- Chi-Square Goodness of Fit Test: This test determines how well an observed frequency distribution fits an expected distribution. For example, it can test if a die is fair by comparing the observed roll outcomes to the expected outcomes.
The chi-square statistic is calculated using the formula:
\[ \chi^2 = \sum \frac{(O_i - E_i)^2}{E_i} \]
where \( O_i \) represents the observed frequency for category \( i \), and \( E_i \) represents the expected frequency for category \( i \). The sum is taken over all categories.
The degrees of freedom for a chi-square test depend on the number of categories and the type of test being performed. For the goodness of fit test, the degrees of freedom are \( k - 1 \), where \( k \) is the number of categories. For the test of independence, the degrees of freedom are \( (r-1) \times (c-1) \), where \( r \) is the number of rows and \( c \) is the number of columns in a contingency table.
Chi-square tests are pivotal for hypothesis testing in categorical data analysis. They offer a rigorous method to evaluate whether observed data align with theoretical expectations, thereby guiding researchers in drawing meaningful conclusions from their studies.
What is a Chi-Squared Test Statistic?
A chi-squared (χ²) test statistic is used to determine whether there is a significant difference between the expected and observed frequencies in one or more categories. This test is widely used in statistical hypothesis testing and is applicable when dealing with categorical data.
The chi-squared test can be used in various scenarios, including testing for independence between two variables and goodness of fit tests. It helps to understand if the observed data fits a theoretical distribution or if two variables are related or independent.
-
Types of Chi-Squared Tests:
- Test of Independence: Determines if there is a significant association between two categorical variables.
- Goodness of Fit Test: Checks how well the observed data fits a specific distribution.
The formula for the chi-squared statistic is:
$$
χ² = \sum \frac{{(O_i - E_i)²}}{{E_i}}
$$
where \( O_i \) is the observed frequency and \( E_i \) is the expected frequency. The degrees of freedom for the test are calculated based on the number of categories and the constraints of the problem.
| Degrees of Freedom | Critical Value (0.05) | Critical Value (0.01) |
|---|---|---|
| 1 | 3.841 | 6.635 |
| 2 | 5.991 | 9.210 |
| 3 | 7.815 | 11.345 |
Chi-squared tests are useful for examining the relationship between categorical variables and can be applied to a wide range of fields, including social sciences, biology, and market research.

Types of Chi-Squared Tests
The chi-squared test is a statistical method commonly used for hypothesis testing. There are various types of chi-squared tests, each serving different purposes. Below are some of the primary types:
- Chi-Squared Test for Independence: This test evaluates whether two categorical variables are independent. It's often used in contingency tables where you compare the observed frequencies with the expected frequencies if the variables were independent.
- Chi-Squared Goodness of Fit Test: This test determines if a sample data matches a population with a specific distribution. It compares the observed data with the expected distribution.
- Yates' Correction for Continuity: Applied to 2x2 contingency tables, this correction adjusts the chi-squared formula to reduce errors in approximation by subtracting 0.5 from the absolute difference between each observed and expected value.
- Chi-Squared Test for Variance: Used to test if the variance of a normally distributed population matches a specified value. This is less common as the true variance is usually unknown.
- Other Specific Chi-Squared Tests:
- Cochran-Mantel-Haenszel Chi-Squared Test: Used for stratified or matched-pair data.
- McNemar's Test: Applied to paired nominal data to test for changes in proportions.
- Tukey's Test of Additivity: Assesses if interaction effects are additive.
- Portmanteau Test: Used in time-series analysis to check for autocorrelation.
- Likelihood-Ratio Tests: Compare the fit of nested models in statistical modeling.
Understanding these various types of chi-squared tests allows for their appropriate application in different statistical analyses, ensuring accurate and meaningful results.
Formulas and Calculations
The chi-squared test statistic is used to compare the observed frequencies in a categorical dataset with the expected frequencies derived from a specific hypothesis. The test statistic is calculated using the following formula:
\[
\chi^2 = \sum \frac{(O_i - E_i)^2}{E_i}
\]
where \(O_i\) is the observed frequency and \(E_i\) is the expected frequency.
Steps to Calculate Chi-Squared Test Statistic
- Determine the observed frequencies (\(O_i\)) from your data.
- Calculate the expected frequencies (\(E_i\)) based on the hypothesis you are testing.
- Compute the differences between the observed and expected frequencies (\(O_i - E_i\)).
- Square each difference to get \((O_i - E_i)^2\).
- Divide each squared difference by the expected frequency (\(E_i\)) to get \(\frac{(O_i - E_i)^2}{E_i}\).
- Sum all the values from step 5 to get the chi-squared statistic (\(\chi^2\)).
Example Calculation
Suppose we have a dataset with observed and expected frequencies as follows:
| Category | Observed (O) | Expected (E) | (O - E) | (O - E)2 | (O - E)2 / E |
|---|---|---|---|---|---|
| A | 50 | 40 | 10 | 100 | 2.5 |
| B | 30 | 40 | -10 | 100 | 2.5 |
| C | 20 | 20 | 0 | 0 | 0 |
Summing the values in the last column gives us the chi-squared statistic:
\[
\chi^2 = 2.5 + 2.5 + 0 = 5
\]
Interpreting the Chi-Squared Statistic
The chi-squared statistic is compared to a critical value from the chi-squared distribution table with \(n - 1\) degrees of freedom (where \(n\) is the number of categories). If the chi-squared statistic is greater than the critical value, we reject the null hypothesis, indicating a significant difference between the observed and expected frequencies.
Applications of Chi-Squared Tests
The Chi-Squared test is widely used in various fields due to its versatility in analyzing categorical data. Here are some common applications:
- Goodness of Fit: This test determines how well an observed frequency distribution matches an expected distribution. It is often used in genetics to see if offspring traits follow expected Mendelian ratios.
- Test of Independence: This test assesses whether two categorical variables are independent of each other. For instance, it can be used in market research to examine if customer preferences are independent of demographic factors.
- Homogeneity: This test compares the distribution of a categorical variable across different populations. It is used in public health to compare the prevalence of a disease across different groups.
Below is a detailed table showing examples of each application:
| Application | Example | Description |
|---|---|---|
| Goodness of Fit | Genetic Trait Distribution | Testing if the observed frequencies of genetic traits match the expected Mendelian ratios. |
| Test of Independence | Customer Preferences | Examining if customer preferences for a product are independent of their demographic characteristics. |
| Homogeneity | Disease Prevalence | Comparing the prevalence of a disease in different population groups to see if they are homogeneous. |
Overall, the Chi-Squared test is a powerful tool for statisticians and researchers, providing insights into the relationships and distributions of categorical variables.
Assumptions and Conditions
To ensure the validity and reliability of chi-squared tests, several important assumptions and conditions must be met:
- Independence of Observations: Each observation in the dataset must be independent of all others. This means that the occurrence of one event should not influence the occurrence of another.
- Sample Size: The sample size should be sufficiently large. A common rule of thumb is that the expected frequency for each category should be at least 5. If more than 20% of the expected frequencies are below 5, the chi-squared test may not be appropriate.
- Expected Frequencies: The test should not be used if any expected frequency is less than 1. This ensures that the approximation to the chi-squared distribution is valid.
- Categories: The categories should be mutually exclusive and exhaustive. Each observation must fall into one and only one category.
- Random Sampling: The data should be collected through a process of random sampling to ensure that the sample is representative of the population.
When these assumptions are met, the chi-squared test can be a powerful tool for statistical analysis. If these conditions are not satisfied, alternative statistical methods may be more appropriate.
Interpreting Chi-Squared Test Results
Interpreting the results of a chi-squared test involves several key steps to determine the significance and implications of the test statistic. Here’s a detailed guide:
-
Calculate the Chi-Squared Test Statistic
The chi-squared test statistic is calculated using the observed and expected frequencies in a contingency table. The formula for the chi-squared statistic is:
\[
\chi^2 = \sum \frac{(O_i - E_i)^2}{E_i}
\]where \(O_i\) is the observed frequency and \(E_i\) is the expected frequency for each category.
-
Determine Degrees of Freedom
The degrees of freedom (df) for a chi-squared test depends on the type of test being performed:
- For a test of independence: \( df = (r - 1) \times (c - 1) \)
- For a goodness-of-fit test: \( df = k - 1 \)
where \(r\) is the number of rows and \(c\) is the number of columns in the contingency table, and \(k\) is the number of categories.
-
Find the Critical Value
Using a chi-squared distribution table, find the critical value that corresponds to the calculated degrees of freedom and the chosen significance level (usually 0.05). This value is the threshold beyond which the null hypothesis is rejected.
-
Compare the Test Statistic to the Critical Value
Compare the chi-squared test statistic to the critical value:
- If the test statistic is greater than the critical value, reject the null hypothesis.
- If the test statistic is less than or equal to the critical value, fail to reject the null hypothesis.
-
Interpret the P-Value
The p-value represents the probability that the observed data could have occurred under the null hypothesis. It is found by comparing the test statistic to a chi-squared distribution. If the p-value is less than the chosen significance level (e.g., 0.05), it indicates strong evidence against the null hypothesis.
-
Conclusion
Based on the comparison and the p-value:
- Reject the Null Hypothesis if the test statistic exceeds the critical value or the p-value is less than the significance level. This suggests that there is a statistically significant association between the variables.
- Fail to Reject the Null Hypothesis if the test statistic does not exceed the critical value or the p-value is greater than the significance level. This suggests that there is no statistically significant association between the variables.
Proper interpretation of chi-squared test results is crucial for understanding the relationships between categorical variables in various research contexts.
Common Issues and Solutions
When conducting chi-squared tests, researchers often encounter several common issues. Here, we outline these issues along with practical solutions to address them effectively.
-
Small Sample Sizes
Chi-squared tests rely on the assumption that the sample size is sufficiently large. Small sample sizes can lead to inaccurate results.
- Solution: Ensure each expected cell frequency is at least 5. If not, consider combining categories or using Fisher's Exact Test instead.
-
Zero Frequencies
Zero frequencies in contingency tables can distort the chi-squared statistic and lead to misleading conclusions.
- Solution: Combine categories to eliminate zeros or apply Yates's correction for continuity in 2x2 tables.
-
Data Independence
The chi-squared test assumes that the data points are independent. Violations of this assumption can bias the results.
- Solution: Ensure the data collection process avoids sampling the same subject more than once. Use randomized and independent sampling methods.
-
Expected Frequency Distribution
If the expected frequency distribution does not match the observed distribution closely, the chi-squared test might not be appropriate.
- Solution: Use a different statistical test if the data do not meet the expected frequency distribution assumptions.
-
Overfitting
Fitting too many categories or parameters can lead to overfitting, where the model fits the sample data too closely.
- Solution: Simplify the model by reducing the number of categories or parameters being tested.
Advantages and Disadvantages
The chi-squared test statistic is a versatile tool in statistical analysis, especially for categorical data. However, like any statistical method, it has its strengths and weaknesses.
Advantages
- Tests Categorical Data: The chi-squared test is specifically designed for categorical data, making it ideal for surveys and studies involving discrete groups or categories.
- No Assumptions about Distribution: Unlike many other statistical tests, the chi-squared test does not require the data to follow a normal distribution, offering flexibility in various applications.
- Easy to Calculate and Interpret: The calculations involved in the chi-squared test are straightforward, and the results are relatively easy to interpret, even for those with a basic understanding of statistics.
- Can Handle Large Sample Sizes: This test is robust with large datasets, making it suitable for extensive research and large-scale studies.
- Works with Multiple Categories: The chi-squared test can handle data with more than two categories, allowing for broader and more complex analyses.
Disadvantages
- Only for Categorical Data: The chi-squared test is limited to categorical data and cannot be used for continuous or numerical variables.
- Sensitive to Sample Size: The test's sensitivity means that very small or very large sample sizes can skew results, potentially leading to misleading conclusions.
- Assumes Independent Observations: One of the key assumptions is that the observations are independent. Violations of this assumption can compromise the validity of the test results.
- Requires Large Sample Size: For the test to be effective, a sufficiently large sample size is necessary, which can be a limitation in studies with limited data.
- Cannot Determine Cause-Effect Relationship: While the chi-squared test can identify associations between variables, it cannot establish causation, limiting its interpretive power in understanding underlying relationships.
Examples in Software
Chi-squared tests can be performed using various software tools. Below are detailed steps for conducting chi-squared tests in Excel, R, and Python.
Excel
- Input your observed data into a table format in Excel.
- Calculate the expected frequencies for each category.
- Use the
CHISQ.TESTfunction to compute the chi-squared test statistic and p-value:- Syntax:
=CHISQ.TEST(actual_range, expected_range)
- Syntax:
- Interpret the p-value to determine if you can reject the null hypothesis.
R
- Create a table of observed frequencies:
data <- matrix(c(120, 90, 40, 110, 95, 45), ncol=3, byrow=TRUE) colnames(data) <- c("Rep", "Dem", "Ind") rownames(data) <- c("Male", "Female") data <- as.table(data) - Perform the chi-squared test using the
chisq.testfunction:chisq.test(data) - Interpret the output which includes the chi-squared test statistic, degrees of freedom, and p-value.
Python
- Install the
scipylibrary if not already installed:pip install scipy - Import the necessary libraries and prepare your data:
import numpy as np from scipy.stats import chi2_contingency # Create the observed frequency table observed = np.array([[120, 90, 40], [110, 95, 45]]) - Perform the chi-squared test:
chi2, p, dof, expected = chi2_contingency(observed) print(f'Chi-squared: {chi2}, p-value: {p}, Degrees of Freedom: {dof}') print(f'Expected frequencies: {expected}') - Interpret the p-value to decide whether to reject the null hypothesis.
SPSS
- Open SPSS and import your data.
- Navigate to
Analyze -> Descriptive Statistics -> Crosstabs. - Drag your variables into the Row(s) and Column(s) boxes.
- Click on
Statisticsand selectChi-square. - Click
Continueand thenOKto run the test. - Interpret the results in the output viewer, focusing on the chi-squared value and p-value.

Advanced Topics
The chi-squared test statistic has several advanced topics and applications that extend its basic usage. These include corrections for continuity, tests for variance in a normal population, and specific tests for different types of data structures.
Yates's Correction for Continuity
Yates's correction for continuity is used to adjust the chi-squared test when dealing with 2x2 contingency tables. This correction is applied by subtracting 0.5 from the absolute difference between each observed value and its expected value. This adjustment reduces the chi-squared value and, consequently, increases its p-value, making the test more conservative:
\[
\chi^2 = \sum \frac{(|O_i - E_i| - 0.5)^2}{E_i}
\]
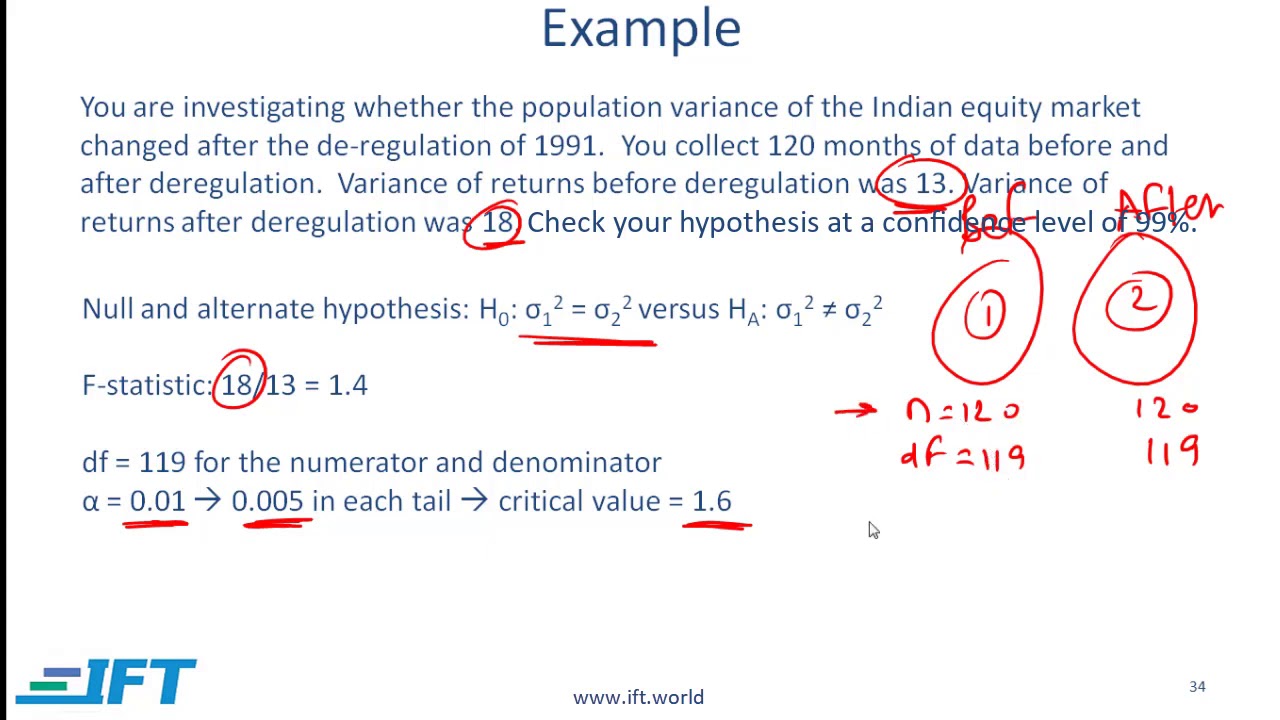
Chi-Squared Test for Variance in a Normal Population
This test evaluates whether the variance of a normally distributed population matches a specified value. The test statistic \( T \) is calculated as the sum of squared deviations from the sample mean divided by the nominal variance value. The resulting statistic follows a chi-squared distribution with \( n-1 \) degrees of freedom:
\[
T = \frac{(n-1)s^2}{\sigma^2}
\]
where \( s^2 \) is the sample variance, and \( \sigma^2 \) is the population variance under the null hypothesis.
Non-Central Chi-Squared Distribution
The non-central chi-squared distribution is used in situations where the null hypothesis is not true, introducing a non-centrality parameter. It is commonly applied in power analysis and in tests involving mean differences where non-centrality provides a measure of the effect size.
Cochran-Mantel-Haenszel Test
The Cochran-Mantel-Haenszel test is used to assess the association between two variables while controlling for a third. It is particularly useful in stratified or matched pair designs, providing a more powerful statistic compared to the basic Pearson chi-squared test:
\[
\text{CMH} = \frac{\sum \frac{(O_i - E_i)^2}{E_i}}{(1 - \sum \frac{(O_i - E_i)^2}{N_i})}
\]
McNemar's Test
McNemar's test is applied to 2x2 contingency tables with paired samples to test for changes in responses. It is useful in before-and-after studies or in matched pair experiments:
\[
\chi^2 = \frac{(b - c)^2}{b + c}
\]
where \( b \) and \( c \) are the discordant pairs.
These advanced topics highlight the versatility and broad applicability of the chi-squared test statistic in various statistical analyses.
Further Reading and Resources
To deepen your understanding of the chi-squared test statistic and its applications, consider exploring the following resources:
- Books:
- Statistics for Dummies by Deborah J. Rumsey - A comprehensive guide for beginners in statistics, covering the basics of chi-squared tests and more.
- Introduction to the Practice of Statistics by David S. Moore, George P. McCabe, and Bruce A. Craig - A detailed textbook that includes chi-squared tests among other statistical methods.
- The Art of Statistics: Learning from Data by David Spiegelhalter - This book provides an insightful look into various statistical methods, including chi-squared tests.
- Online Courses and Tutorials:
- Khan Academy - - A free resource that includes video tutorials and practice problems on chi-squared tests.
- Coursera - - Various courses offered by universities that cover chi-squared tests and other statistical techniques.
- edX - - Courses from top universities providing in-depth knowledge of statistical methods.
- Websites and Articles:
- - Detailed explanations and examples of chi-squared tests.
- - Tutorials and examples on how to perform chi-squared tests using R.
- - Simplified explanations and interactive examples of chi-squared tests.
- Software Documentation and Guides:
- - Official documentation for the
chisq.testfunction in R. - - Guides on using Excel for statistical analysis, including chi-squared tests.
- - Information on performing chi-squared tests using Python's SciPy library.
- - Official documentation for the
These resources will provide you with a solid foundation and advanced insights into the chi-squared test statistic, enhancing your knowledge and analytical skills.
Kiểm Định Chi-Square
READ MORE:
Kiểm Định Chi-Square [Giải Thích Đơn Giản]