Topic chi square value table: The chi-square value table is a fundamental tool in statistical analysis, helping researchers determine associations between categorical variables. This guide will walk you through the significance of the chi-square test, how to use the chi-square value table, and its applications in various fields. Master this essential statistical tool today!
Table of Content
- Chi-Square Value Table
- Introduction to Chi-Square Tests
- Understanding Chi-Square Distribution
- Formula for Chi-Square Test
- Degrees of Freedom in Chi-Square Test
- Significance Levels and P-Values
- How to Use the Chi-Square Value Table
- Example of Chi-Square Value Table
- Interpreting the Chi-Square Value Table
- Applications of Chi-Square Tests
- Common Mistakes and Misconceptions
- FAQs about Chi-Square Tests
- Conclusion and Further Reading
- YOUTUBE: Xem video về Phân Tích Kiểm Định Chi Bình Phương để hiểu sâu hơn về phương pháp thống kê quan trọng này.
Chi-Square Value Table
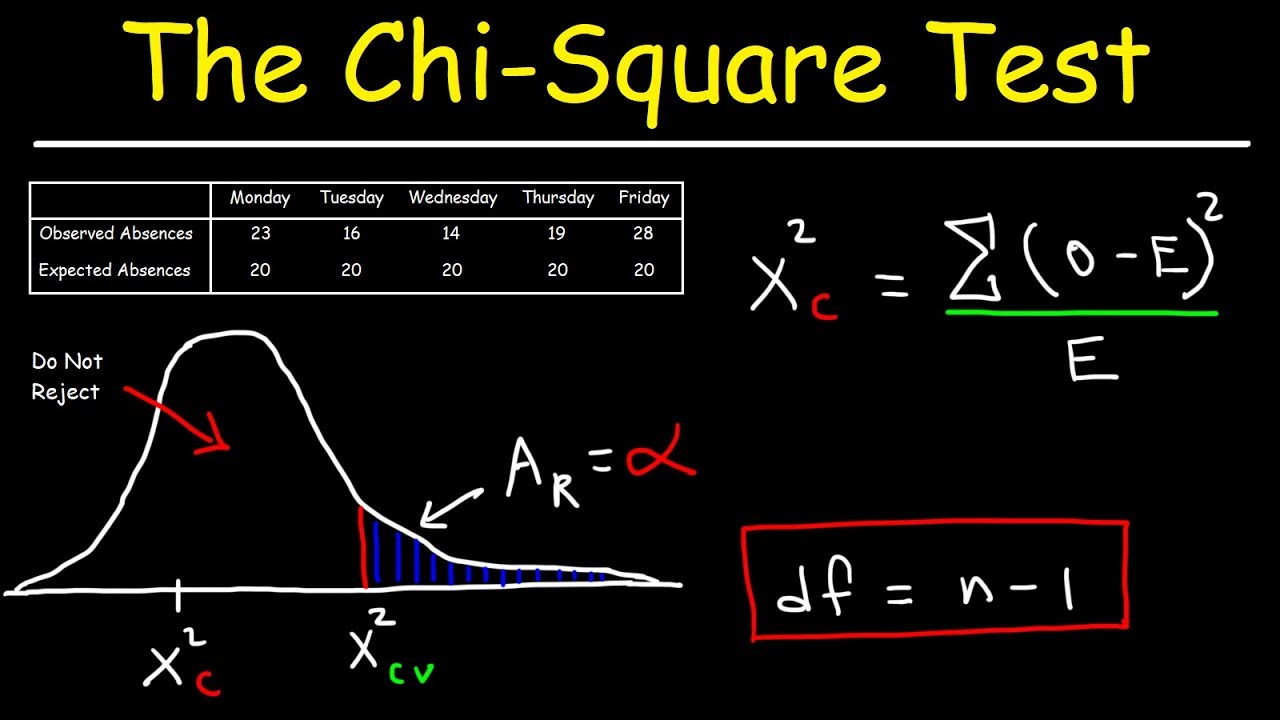
The chi-square value table is a crucial tool in statistics for hypothesis testing. It is used to determine whether there is a significant association between two categorical variables. Below is an overview of the chi-square distribution and how to use the chi-square value table.
Chi-Square Distribution
The chi-square distribution is defined by the following formula:
\[
\chi^2 = \sum \frac{(O_i - E_i)^2}{E_i}
\]
where \( O_i \) represents the observed frequency and \( E_i \) represents the expected frequency.
Chi-Square Value Table
The chi-square value table provides critical values of the chi-square distribution at various significance levels (e.g., 0.01, 0.05) and degrees of freedom (df). To use the table:
- Determine the degrees of freedom (df) for your test. For a chi-square test, df is typically calculated as the number of categories minus one.
- Select the significance level (alpha), commonly 0.05 or 0.01.
- Find the critical value in the table corresponding to your df and significance level.
Example Chi-Square Value Table
| Degrees of Freedom (df) | 0.01 | 0.05 | 0.10 |
|---|---|---|---|
| 1 | 6.63 | 3.84 | 2.71 |
| 2 | 9.21 | 5.99 | 4.61 |
| 3 | 11.34 | 7.82 | 6.25 |
| 4 | 13.28 | 9.49 | 7.78 |
Conclusion
The chi-square value table is essential for conducting chi-square tests in statistics. By comparing the calculated chi-square statistic to the critical value from the table, researchers can determine whether to reject the null hypothesis, indicating a significant association between variables.
READ MORE:
Introduction to Chi-Square Tests
The chi-square test is a statistical method used to determine if there is a significant association between categorical variables. It compares the observed frequencies of events to the expected frequencies under the null hypothesis, which assumes no association between the variables.
The chi-square test is used in various fields, including biology, psychology, marketing, and social sciences. It is particularly useful for analyzing survey data and experimental results.
Here are the steps to perform a chi-square test:
- Formulate the Hypotheses
- Null Hypothesis (\(H_0\)): Assumes no association between the variables.
- Alternative Hypothesis (\(H_a\)): Assumes an association between the variables.
- Calculate the Expected Frequencies
Use the formula to calculate the expected frequency (\(E_i\)) for each category:
\[
E_i = \frac{(Row\ Total \times Column\ Total)}{Grand\ Total}
\] - Compute the Chi-Square Statistic
Apply the chi-square formula:
\[
\chi^2 = \sum \frac{(O_i - E_i)^2}{E_i}
\]where \(O_i\) is the observed frequency and \(E_i\) is the expected frequency.
- Determine the Degrees of Freedom (df)
The degrees of freedom for a chi-square test are calculated as:
\[
df = (Number\ of\ Rows - 1) \times (Number\ of\ Columns - 1)
\] - Find the Critical Value
Using the chi-square value table, find the critical value corresponding to your degrees of freedom and chosen significance level (e.g., 0.05).
- Compare the Chi-Square Statistic to the Critical Value
- If \(\chi^2\) is greater than the critical value, reject the null hypothesis.
- If \(\chi^2\) is less than or equal to the critical value, do not reject the null hypothesis.
By following these steps, you can determine whether there is a statistically significant association between the categorical variables in your study.
Understanding Chi-Square Distribution
The chi-square distribution is a continuous probability distribution that is widely used in statistical significance tests. It is particularly important in the context of chi-square tests, which are used to assess hypotheses about categorical data.
The chi-square distribution has the following key characteristics:
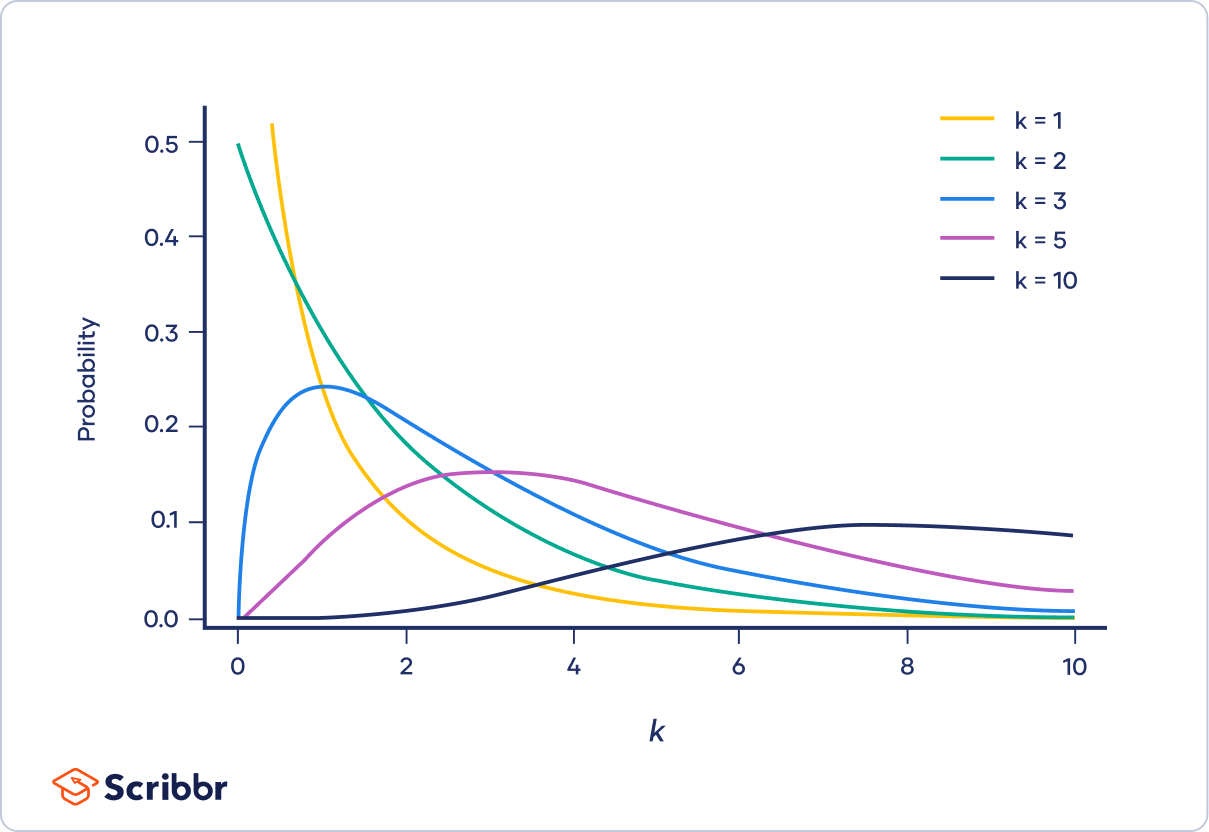
- The distribution is asymmetrical and skewed to the right. As the degrees of freedom increase, the distribution becomes more symmetrical and approaches a normal distribution.
- The shape of the chi-square distribution is determined by the degrees of freedom (df). Degrees of freedom generally refer to the number of independent values in a calculation.
- The mean of a chi-square distribution is equal to the degrees of freedom (\( \mu = df \)).
- The variance of a chi-square distribution is equal to twice the degrees of freedom (\( \sigma^2 = 2 \cdot df \)).
The probability density function (PDF) for the chi-square distribution with \( k \) degrees of freedom is given by:
\[
f(x; k) = \frac{x^{(k/2)-1} e^{-x/2}}{2^{k/2} \Gamma(k/2)}
\]
where \( x \) is the chi-square statistic, \( k \) is the degrees of freedom, and \( \Gamma \) is the gamma function.
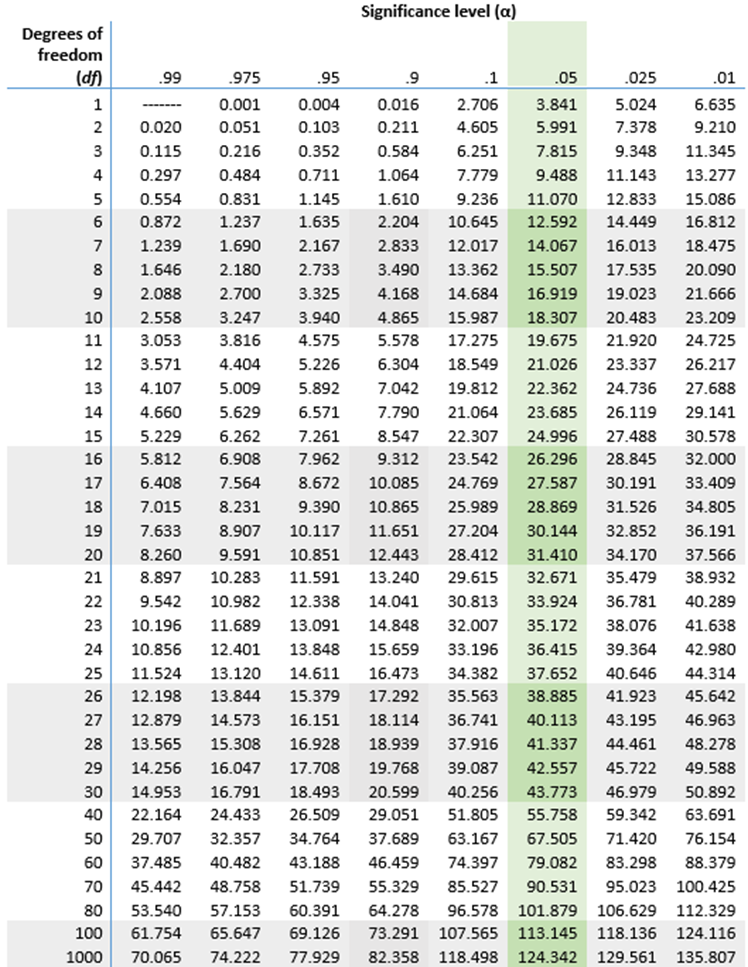
Below is a table illustrating the critical values of the chi-square distribution for different significance levels and degrees of freedom:
| Degrees of Freedom (df) | 0.01 | 0.05 | 0.10 |
|---|---|---|---|
| 1 | 6.635 | 3.841 | 2.706 |
| 2 | 9.210 | 5.991 | 4.605 |
| 3 | 11.345 | 7.815 | 6.251 |
| 4 | 13.277 | 9.488 | 7.779 |
To interpret the chi-square distribution, one often compares the calculated chi-square statistic from sample data to the critical value from the chi-square distribution table. If the calculated value is greater than the critical value at a given significance level, the null hypothesis is rejected.
Understanding the chi-square distribution is crucial for conducting chi-square tests, which are applied in various fields such as genetics, marketing, and social sciences to determine if there is a significant association between categorical variables.
Formula for Chi-Square Test
The chi-square test is a statistical method used to determine if there is a significant association between categorical variables. There are two main types of chi-square tests: the chi-square goodness-of-fit test and the chi-square test of independence.
Chi-Square Goodness-of-Fit Test
This test is used to determine whether a sample data matches a population with a specific distribution. The formula for the chi-square goodness-of-fit test is:
\[
\chi^2 = \sum \frac{(O_i - E_i)^2}{E_i}
\]
where:
- \( \chi^2 \) is the chi-square statistic.
- \( O_i \) represents the observed frequency for the i-th category.
- \( E_i \) represents the expected frequency for the i-th category.
Chi-Square Test of Independence
This test is used to determine if there is a significant association between two categorical variables. The formula for the chi-square test of independence is the same as the goodness-of-fit test:
\[
\chi^2 = \sum \frac{(O_i - E_i)^2}{E_i}
\]
where the terms have similar meanings:
- \( O_i \) represents the observed frequency in the i-th cell of a contingency table.
- \( E_i \) represents the expected frequency in the i-th cell, calculated as:
\[
E_i = \frac{(row \, total) \times (column \, total)}{grand \, total}
\]
Steps to Perform a Chi-Square Test
- State the hypotheses:
- Null hypothesis (\( H_0 \)): There is no significant association between the variables.
- Alternative hypothesis (\( H_1 \)): There is a significant association between the variables.
- Calculate the expected frequencies: Use the formula for \( E_i \) to determine the expected counts for each cell in the contingency table.
- Compute the chi-square statistic: Use the chi-square formula to calculate the test statistic.
- Determine the degrees of freedom (df): For a test of independence, \( df = (rows - 1) \times (columns - 1) \).
- Compare the chi-square statistic to the critical value: Use the chi-square distribution table to find the critical value at your chosen significance level (\( \alpha \)).
- Make a decision: If the calculated chi-square statistic is greater than the critical value, reject the null hypothesis.
The chi-square test is a powerful tool for analyzing categorical data and determining relationships between variables. Proper application and interpretation of the test can provide valuable insights in various fields such as biology, marketing, and social sciences.
Degrees of Freedom in Chi-Square Test
The concept of degrees of freedom (df) is crucial in conducting a Chi-Square test. Degrees of freedom refer to the number of values in the final calculation of a statistic that are free to vary.
In a Chi-Square test, degrees of freedom are determined by the size of the contingency table, which is based on the number of categories in the data. Here's how to calculate degrees of freedom for different types of Chi-Square tests:
- Chi-Square Test for Independence: For a contingency table with \( r \) rows and \( c \) columns, the degrees of freedom is calculated as:
\[ df = (r - 1) \times (c - 1) \] For example, if you have a 3x3 table (3 rows and 3 columns), the degrees of freedom would be: \[ df = (3 - 1) \times (3 - 1) = 2 \times 2 = 4 \] - Chi-Square Test for Goodness of Fit: When testing how well an observed distribution fits an expected distribution, the degrees of freedom is calculated as:
\[ df = k - 1 \] where \( k \) is the number of categories. For instance, if there are 5 categories, the degrees of freedom would be: \[ df = 5 - 1 = 4 \] - Chi-Square Test for Homogeneity: This test compares the distribution of a categorical variable across different populations. The degrees of freedom is similar to the test for independence:
\[ df = (r - 1) \times (c - 1) \]
Understanding degrees of freedom helps in determining the critical value from the Chi-Square distribution table, which is then used to evaluate the test statistic and make decisions about the null hypothesis.
Significance Levels and P-Values
In statistical hypothesis testing, significance levels and p-values are critical concepts used to determine the strength of the evidence against the null hypothesis. Here's a detailed explanation of these concepts:
Significance Levels
The significance level, denoted by alpha (α), is the probability threshold set by the researcher before conducting a hypothesis test. Common significance levels are 0.05, 0.01, and 0.10, with 0.05 being the most frequently used.
- α = 0.05: There is a 5% risk of concluding that a difference exists when there is no actual difference.
- α = 0.01: There is a 1% risk of a Type I error (rejecting a true null hypothesis).
- α = 0.10: There is a 10% risk of making a Type I error.
P-Values
The p-value measures the probability of obtaining test results at least as extreme as the results actually observed, assuming that the null hypothesis is correct. It helps to determine the statistical significance of the test results.
- p-value < 0.05: Strong evidence against the null hypothesis, so it is rejected. The result is considered statistically significant.
- p-value > 0.05: Weak evidence against the null hypothesis, so it is not rejected. The result is not statistically significant.
Relationship Between Significance Levels and P-Values
In hypothesis testing, the p-value is compared to the predetermined significance level (α) to make a decision:
- If p-value ≤ α, reject the null hypothesis. The result is statistically significant.
- If p-value > α, do not reject the null hypothesis. The result is not statistically significant.
Example of Using P-Values and Significance Levels
Suppose you perform a chi-square test with a significance level of 0.05. After calculating, you obtain a p-value of 0.03. Since 0.03 is less than 0.05, you reject the null hypothesis and conclude that the result is statistically significant.
Chi-Square Value Table and P-Values
To find the p-value from the chi-square test, you perform the test to obtain the chi-square statistic and the degrees of freedom. Then, you use the chi-square distribution table to find the corresponding p-value range.
| Degrees of Freedom | 0.05 | 0.01 | 0.001 |
|---|---|---|---|
| 1 | 3.841 | 6.635 | 10.828 |
| 2 | 5.991 | 9.210 | 13.816 |
| 3 | 7.815 | 11.345 | 16.266 |
Using this table, if your chi-square statistic is 7.815 with 2 degrees of freedom, the p-value is approximately 0.05, indicating that the result is on the threshold of being statistically significant.
How to Use the Chi-Square Value Table
The Chi-Square Value Table is a crucial tool for determining the critical value of a chi-square statistic. Here's a step-by-step guide on how to use it effectively:
-
Determine the Degrees of Freedom (df): The degrees of freedom for a chi-square test depend on the type of test you're performing. Generally, it is calculated as:
- Goodness of Fit Test: \( df = n - 1 \), where \( n \) is the number of categories.
- Test for Independence: \( df = (r - 1) \times (c - 1) \), where \( r \) is the number of rows and \( c \) is the number of columns in the contingency table.
-
Choose the Significance Level (α): The significance level (commonly 0.05 or 0.01) represents the probability of rejecting the null hypothesis when it is true. The corresponding confidence level is \( 1 - \alpha \).
-
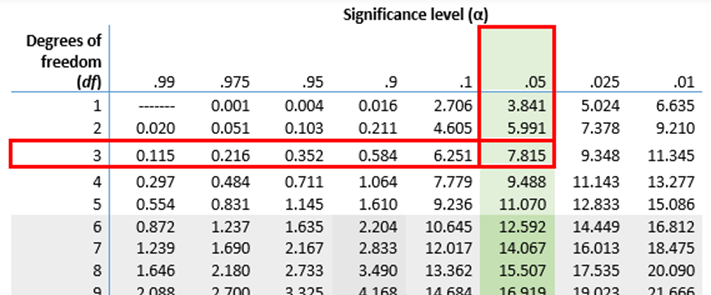
Locate the Critical Value in the Table: Using the degrees of freedom and the chosen significance level, find the intersection in the chi-square table. This value is the critical value.
For example, if you have 3 degrees of freedom and a significance level of 0.05, locate the row for \( df = 3 \) and the column for \( \alpha = 0.05 \).
-
Compare the Test Statistic to the Critical Value: Calculate your chi-square test statistic using the formula:
\[
\chi^2 = \sum \frac{(O_i - E_i)^2}{E_i}
\]
where \( O_i \) is the observed frequency and \( E_i \) is the expected frequency.If the test statistic is greater than or equal to the critical value from the table, reject the null hypothesis. Otherwise, fail to reject the null hypothesis.
Here is an example to illustrate the process:
Example: Suppose you are conducting a chi-square test for independence with a 2x3 contingency table. The degrees of freedom are:
\[
df = (2 - 1) \times (3 - 1) = 1 \times 2 = 2
\]
If you choose a significance level of 0.05, you would find the critical value in the chi-square table at the intersection of \( df = 2 \) and \( \alpha = 0.05 \). Let's say the critical value is 5.991.
After calculating your chi-square test statistic, compare it to 5.991. If your test statistic is greater than 5.991, you reject the null hypothesis.
Example of Chi-Square Value Table
The Chi-Square value table is a critical tool in statistics for determining the critical value of the Chi-Square statistic given the degrees of freedom and the significance level. Below is an example of a Chi-Square value table for various degrees of freedom (df) and significance levels (α).
| df | 0.995 | 0.975 | 0.90 | 0.50 | 0.10 | 0.05 | 0.025 | 0.01 | 0.005 |
|---|---|---|---|---|---|---|---|---|---|
| 1 | 0.000 | 0.001 | 0.016 | 0.455 | 2.706 | 3.841 | 5.024 | 6.635 | 7.879 |
| 2 | 0.010 | 0.051 | 0.211 | 1.386 | 4.605 | 5.991 | 7.378 | 9.210 | 10.597 |
| 3 | 0.072 | 0.216 | 0.584 | 2.366 | 6.251 | 7.815 | 9.348 | 11.345 | 12.838 |
| 4 | 0.207 | 0.484 | 1.064 | 3.357 | 7.779 | 9.488 | 11.143 | 13.277 | 14.860 |
| 5 | 0.412 | 0.831 | 1.610 | 4.351 | 9.236 | 11.070 | 12.833 | 15.086 | 16.750 |
To use this table, follow these steps:
- Determine the degrees of freedom (df) for your test. This is typically the number of categories minus one.
- Choose your significance level (α), which is the probability of rejecting the null hypothesis when it is actually true. Common choices are 0.05, 0.01, and 0.001.
- Find the corresponding critical value in the table. For example, if you have 2 degrees of freedom and a significance level of 0.05, the critical value is 5.991.
- Compare your calculated Chi-Square statistic to the critical value. If your statistic is greater than the critical value, you reject the null hypothesis.
Below is an example demonstrating how to use the Chi-Square value table:
Example: Suppose you have conducted a Chi-Square test for independence with a 2x2 contingency table. You have 1 degree of freedom (df) and are using a significance level of 0.05.
- Your calculated Chi-Square statistic is 4.2.
- From the table, the critical value for 1 df and α = 0.05 is 3.841.
- Since 4.2 > 3.841, you reject the null hypothesis, indicating that there is a significant association between the variables.
Interpreting the Chi-Square Value Table
The Chi-Square value table is a crucial tool in determining whether there is a significant association between two categorical variables. Here’s a step-by-step guide on how to interpret it:
-
Identify the Chi-Square Statistic:
The Chi-Square statistic (denoted as χ2) is calculated based on the difference between the observed and expected frequencies in a contingency table. This value can be found in the 'Value' column under 'Pearson Chi-Square' in statistical software outputs.
-
Determine the Degrees of Freedom (DF):
The degrees of freedom for a Chi-Square test is calculated as:
DF = (R - 1) \times (C - 1) where R is the number of rows and C is the number of columns in the contingency table. The DF value helps to locate the corresponding critical value in the Chi-Square distribution table.
-
Find the Significance Level (α):
Common significance levels are 0.05, 0.01, and 0.001. This value represents the probability threshold for determining whether the observed association is statistically significant.
-
Locate the Critical Value:
Using the degrees of freedom and the chosen significance level, locate the critical value in the Chi-Square distribution table. This value is the threshold that your Chi-Square statistic needs to exceed to reject the null hypothesis.
-
Compare the Chi-Square Statistic to the Critical Value:
-
Chi-Square Statistic > Critical Value: If the computed Chi-Square statistic is greater than the critical value from the table, you reject the null hypothesis. This indicates a significant association between the variables.
-
Chi-Square Statistic ≤ Critical Value: If the Chi-Square statistic is less than or equal to the critical value, you fail to reject the null hypothesis, indicating no significant association between the variables.
-
-
Check the P-Value:
Most statistical software also provides a p-value, which is the probability of obtaining a test statistic at least as extreme as the one observed, assuming the null hypothesis is true. Compare the p-value to your significance level:
- p-value ≤ α: Reject the null hypothesis, indicating a significant association.
- p-value > α: Fail to reject the null hypothesis, indicating no significant association.
By following these steps, you can accurately interpret the results of a Chi-Square test and understand the significance of the associations between your categorical variables.
Applications of Chi-Square Tests
The Chi-Square test is a versatile statistical tool used in various fields to analyze categorical data. Here are some common applications:
- Testing for Independence: The Chi-Square test is frequently used to determine if there is a significant association between two categorical variables. For example, in a study to find if gender is related to preference for a new product, the test helps determine if preferences are independent of gender.
- Goodness of Fit: This application checks how well an observed distribution fits an expected distribution. For instance, if a dice is suspected to be biased, the Chi-Square test can compare the observed roll outcomes to the expected equal frequencies for a fair dice.
- Homogeneity: The test can assess whether different populations have the same distribution of a categorical variable. For example, it can be used to check if different regions have similar voter preferences.
- Clinical Trials: In medical research, the Chi-Square test is used to compare the effectiveness of different treatments. For instance, comparing the improvement rates between a new drug and a placebo can be evaluated using a 2x2 contingency table and the Chi-Square test.
- Survey Analysis: When analyzing survey data, the test helps in determining if there are significant differences between groups. For example, analyzing customer satisfaction ratings across different store locations to see if location impacts satisfaction levels.
Overall, the Chi-Square test is an essential tool in statistical analysis, providing insights into relationships between categorical variables across diverse research and practical applications.
Common Mistakes and Misconceptions
Understanding and correctly applying chi-square tests is crucial for statistical analysis, but it's common to encounter certain misconceptions. Here are some key points to consider:
- Confusing Independence and Association: One major mistake is assuming that chi-square tests can determine causality. They only assess association between variables, not whether one causes the other.
- Small Sample Sizes: Using chi-square tests with small sample sizes can lead to inaccurate results. Ensure your sample size meets the test's assumptions for reliability.
- Invalid Use in Continuous Data: Chi-square tests are meant for categorical data. Applying them to continuous or ordinal data without appropriate transformation can yield misleading outcomes.
- Incorrect Interpretation of Significance: A significant chi-square test result indicates a significant association, not necessarily a strong one. Always consider effect size measures alongside p-values.
- Improper Application of Assumptions: Violating assumptions like expected cell counts can invalidate results. Ensure conditions like expected frequencies per cell are met to ensure test validity.
- Ignoring Degrees of Freedom: Each chi-square test has specific degrees of freedom, which affect the interpretation of the chi-square statistic. Ignoring this can lead to misinterpretation of results.
By avoiding these common pitfalls and understanding the nuances of chi-square tests, researchers can effectively use this statistical tool to derive meaningful insights from categorical data.
FAQs about Chi-Square Tests
Chi-square tests are widely used in statistical analysis to assess the association between categorical variables. Here are answers to some frequently asked questions:
- What is a chi-square test?
A chi-square test is a statistical method used to determine if there is a significant association between categorical variables.
- When should I use a chi-square test?
Chi-square tests are appropriate when you have categorical data and want to test whether there is a relationship between two variables.
- What are the types of chi-square tests?
There are two main types: the chi-square test of independence, which tests for association between two categorical variables, and the chi-square test of goodness of fit, which tests whether observed data match expected values.
- How do I interpret the results of a chi-square test?
The test produces a chi-square statistic and a p-value. A significant p-value (typically less than 0.05) suggests evidence to reject the null hypothesis of independence.
- What are the assumptions of a chi-square test?
Assumptions include independent observations, categorical data, and expected frequencies in each cell of the contingency table should be sufficiently large.
- Can chi-square tests determine causation?
No, chi-square tests can only determine association, not causation. They do not provide information on the direction or strength of any relationship.
- How can I calculate degrees of freedom for a chi-square test?
For a chi-square test of independence, degrees of freedom are calculated as (r-1)*(c-1), where r is the number of rows and c is the number of columns in the contingency table.
- What are some alternatives to chi-square tests?
Alternatives include Fisher's exact test for small sample sizes or when expected frequencies are low, and logistic regression for assessing relationships between categorical variables while controlling for other factors.
Conclusion and Further Reading
Chi-square tests provide valuable insights into the relationships between categorical variables, making them essential in statistical analysis. Understanding how to apply and interpret chi-square tests can greatly enhance your ability to draw meaningful conclusions from data.
For further reading on chi-square tests and related topics, consider exploring the following resources:
- Statistical textbooks and academic journals that cover chi-square tests in detail.
- Online tutorials and courses that offer practical examples and exercises for hands-on learning.
- Statistical software documentation, which often includes guidance on conducting chi-square tests and interpreting results.
- Professional statistical societies and forums where researchers discuss best practices and applications of chi-square tests.
By continuing to deepen your understanding of chi-square tests and staying updated on statistical methods, you can effectively apply these tools to address research questions and make informed decisions based on data analysis.

Xem video về Phân Tích Kiểm Định Chi Bình Phương để hiểu sâu hơn về phương pháp thống kê quan trọng này.
Video Chi Square Test - Phân Tích Kiểm Định Chi Bình Phương
READ MORE:
Xem video về Phân Tích Kiểm Định Chi cho dữ liệu đếm để tìm hiểu cách tính toán giá trị p trong thống kê.
Video Phân Tích Kiểm Định Chi Cho Dữ Liệu Đếm: Tìm Giá Trị p


:max_bytes(150000):strip_icc()/Chi-SquareStatistic_Final_4199464-7eebcd71a4bf4d9ca1a88d278845e674.jpg)