Topic y equals negative x squared: Explore the fascinating world of the equation y equals negative x squared. This article delves into its mathematical properties, graphical representation, and practical applications across various fields. Whether you're a student or an enthusiast, gain a deeper understanding of this fundamental quadratic function.
Table of Content
- Understanding y = -x2
- Introduction
- 1. Mathematical Explanation
- 2. Graphical Representation
- 3. Solving Quadratic Equations
- 4. Applications in Various Fields
- 5. Practical Examples and Problems
- 6. Further Reading and Resources
- YOUTUBE: Video hướng dẫn vẽ đồ thị hàm số x bình phương âm, rất hữu ích cho học sinh và sinh viên học toán.
Understanding y = -x2
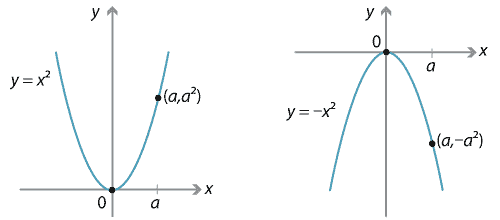
The equation \( y = -x^2 \) represents a parabola that opens downward. This equation is a specific form of a quadratic function, where the coefficient of \( x^2 \) is negative, causing the parabola to open downwards.
Graph of y = -x2
The graph of \( y = -x^2 \) is a parabola that has the following characteristics:
- The vertex of the parabola is at the origin (0, 0).
- The axis of symmetry is the y-axis.
- The parabola opens downward because the coefficient of \( x^2 \) is negative.
Below is a visual representation of the graph:

Properties and Calculations
Here are some steps and properties to consider when working with the equation \( y = -x^2 \):
- Rewrite the equation in vertex form if needed, though \( y = -x^2 \) is already in a simple quadratic form.
- Identify the vertex, which in this case is (0, 0).
- Determine that the parabola opens downward because the coefficient of \( x^2 \) is negative.
- Find additional points by selecting x-values and calculating corresponding y-values to plot the graph.
Applications
The concept of negative \( x^2 \) appears in various fields:
- In mathematics, it can represent the area of a square with a negative side length, though this is more theoretical.
- In physics, it can describe potential energy in certain scenarios.
- In economics and finance, it can illustrate the loss of value or negative growth.
Understanding these applications can help in visualizing and solving problems related to quadratic functions and their graphs.
Example Calculation
Let's find some points on the graph:
| x | y = -x2 |
|---|---|
| -2 | -4 |
| -1 | -1 |
| 0 | 0 |
| 1 | -1 |
| 2 | -4 |
By plotting these points, you can see how the parabola opens downward from the vertex at the origin.
Conclusion
The equation \( y = -x^2 \) is a foundational concept in algebra and pre-calculus, demonstrating the behavior of quadratic functions with a negative leading coefficient. By exploring its graph and properties, students can gain a deeper understanding of parabolic shapes and their applications across various fields.
READ MORE:
Introduction
The equation \( y = -x^2 \) is a fundamental concept in algebra and calculus, representing a parabola that opens downward. This quadratic equation is notable for its symmetrical properties and its ability to model various physical phenomena.
Understanding the behavior and characteristics of \( y = -x^2 \) is essential for students and professionals in mathematics, engineering, physics, and economics. Below, we explore its properties, graphing techniques, and applications in detail.
- Vertex: The highest point of the parabola, located at the origin (0, 0).
- Axis of Symmetry: The line \( x = 0 \), which vertically bisects the parabola.
- Direction: The parabola opens downward because of the negative coefficient of \( x^2 \).
By plotting the equation on a graph, one can visualize the symmetrical, downward-opening shape, which is useful for solving optimization problems and understanding the behavior of quadratic functions under different conditions. Additionally, variations and transformations of this equation, such as \( y = -ax^2 \), where \( a \) is a positive constant, provide further insight into the effects of scaling and reflecting parabolas.
This introduction sets the stage for a deeper exploration of \( y = -x^2 \), covering its derivation, graphical representation, and diverse applications in subsequent sections.
1. Mathematical Explanation
The equation \( y = -x^2 \) represents a downward-opening parabola in the Cartesian coordinate system. This equation is derived from the general form of a quadratic function \( y = ax^2 + bx + c \), where \( a \) determines the direction and width of the parabola. In our case, \( a = -1 \), \( b = 0 \), and \( c = 0 \).
Here is a step-by-step breakdown of the mathematical properties and graph of \( y = -x^2 \):
- Vertex: The vertex of the parabola is at the origin (0,0). This is the highest point on the graph because the parabola opens downward.
- Axis of Symmetry: The axis of symmetry is the vertical line \( x = 0 \). This line divides the parabola into two mirror-image halves.
- Direction: The negative coefficient of \( x^2 \) indicates that the parabola opens downward.
- Intercepts:
- Y-intercept: The graph intersects the y-axis at \( (0,0) \).
- X-intercepts: The graph intersects the x-axis at \( (0,0) \). In this case, the vertex and intercept are the same point.
- Domain and Range:
- Domain: The domain of \( y = -x^2 \) is all real numbers \( (-\infty, \infty) \).
- Range: The range is all real numbers less than or equal to 0 \( (-\infty, 0] \).
- Graph: The graph of \( y = -x^2 \) is a smooth, continuous curve that extends infinitely in the left and right directions but is bounded above by the vertex at \( (0,0) \).
This mathematical explanation provides a foundational understanding of the properties of the quadratic function \( y = -x^2 \), essential for further exploration in algebra and calculus.
2. Graphical Representation
The equation \( y = -x^2 \) represents a parabola that opens downward. This section will guide you through the graphical representation of this quadratic function step by step.
- Vertex: The vertex of the parabola is at the origin, (0,0). This is the highest point on the graph.
- Axis of Symmetry: The parabola is symmetric about the y-axis. The axis of symmetry is the vertical line \( x = 0 \).
- Shape and Direction: Since the coefficient of \( x^2 \) is negative, the parabola opens downward. This means that as the values of \( x \) move away from zero, the values of \( y \) decrease.
- Intercepts:
- Y-Intercept: The y-intercept is at (0,0) since this is where the graph crosses the y-axis.
- X-Intercepts: The x-intercepts are also at (0,0). This is the only point where the graph intersects the x-axis.
- Plotting Points: To plot the graph, choose a set of \( x \) values, compute the corresponding \( y \) values, and plot the points. For example, if \( x = 1 \), then \( y = -1 \); if \( x = -1 \), then \( y = -1 \). Continue this for multiple points to get a clear shape of the parabola.
- Graphing Tools: You can use online graphing tools like Desmos, Symbolab, or Mathway to visualize the function accurately.
By following these steps, you can accurately graph the function \( y = -x^2 \) and understand its characteristics.
3. Solving Quadratic Equations
To solve quadratic equations using the quadratic formula, follow these steps:
-
Standard Form: Ensure the equation is in the standard form \(ax^2 + bx + c = 0\). For example, for the equation \(-x^2 - 3x - 6 = 5x - 8\), rearrange it to \(-x^2 - 8x + 2 = 0\).
-
Identify Coefficients: Identify the coefficients \(a\), \(b\), and \(c\). In our example, \(a = -1\), \(b = -8\), and \(c = 2\).
-
Quadratic Formula: Use the quadratic formula \(x = \frac{-b \pm \sqrt{b^2 - 4ac}}{2a}\). Substitute the coefficients into the formula:
\[
x = \frac{-(-8) \pm \sqrt{(-8)^2 - 4(-1)(2)}}{2(-1)} = \frac{8 \pm \sqrt{64 + 8}}{-2} = \frac{8 \pm \sqrt{72}}{-2}
\] -
Simplify: Simplify the square root and the fraction:
\[
x = \frac{8 \pm 6\sqrt{2}}{-2} = -4 \mp 3\sqrt{2}
\] -
Check Solutions: Verify the solutions by substituting them back into the original equation to ensure both sides are equal.

4. Applications in Various Fields
The equation \( y = -x^2 \) finds applications in various fields beyond pure mathematics. Here are some key areas where this quadratic function is utilized:
- Physics: In physics, the function is used to represent the potential energy of particles in force fields. For instance, the potential energy in a gravitational field can be modeled using a quadratic function.
- Economics: The equation can describe the depreciation of asset values over time. In economics, this negative quadratic relationship is used to model diminishing returns and loss of value.
- Engineering: Engineers use the quadratic function to model parabolic trajectories, such as the path of projectiles. The equation helps in determining the maximum height and range of an object in motion.
- Computer Graphics: In computer graphics, the function is used to create parabolic shapes and curves. This is crucial for rendering realistic animations and simulations.
- Biology: In biology, quadratic equations help in modeling growth rates and population dynamics, providing insights into biological processes that follow a parabolic trend.
Overall, the equation \( y = -x^2 \) serves as a fundamental tool in various disciplines, facilitating the analysis and modeling of complex systems and phenomena.
5. Practical Examples and Problems
Understanding y = -x^2 through practical examples and problems helps to solidify the concept and its applications. Here, we explore step-by-step problem-solving techniques using this quadratic equation.
-
Example 1: Projectile Motion
Consider a ball thrown upwards with an initial velocity. The equation y = -x^2 can represent the ball's height over time, demonstrating the parabolic trajectory.
- Set initial conditions: height, velocity.
- Use the equation y = -x^2 to model the downward motion due to gravity.
- Calculate the time it takes to reach the maximum height and then return to the ground.
-
Example 2: Economics - Profit Maximization
In economics, the equation y = -x^2 can represent profit as a function of production levels. This demonstrates how increasing production initially increases profit, but after a certain point, it decreases due to higher costs.
- Define the cost and revenue functions.
- Set up the profit function Profit = Revenue - Cost.
- Model the profit with y = -x^2 to find the production level that maximizes profit.
-
Example 3: Physics - Optics
The shape of a parabolic mirror can be described by y = -x^2. This explains how parallel rays of light reflect to a single focal point.
- Define the equation of the parabolic mirror.
- Trace the path of light rays entering parallel to the axis.
- Show that all rays meet at the focal point.
By working through these examples and problems, one can gain a deeper understanding of how the equation y = -x^2 is used in various fields.
6. Further Reading and Resources
For those interested in delving deeper into the concept of y = -x², there are numerous resources available online. Here are some recommended sources for further study:
-
This resource provides comprehensive lessons on quadratic functions, including detailed explanations and video tutorials on negative parabolas.
-
MathWorld offers an in-depth exploration of the mathematical properties and implications of negative squares, including y = -x².
-
This lesson provides step-by-step instructions on how to graph quadratic equations where the coefficient of x² is negative. It includes a slide deck, video, and worksheet for practice.
-
Desmos offers an interactive graphing calculator that allows you to visualize and manipulate the graph of y = -x² and other quadratic functions in real time.
-
Mathway provides tools to solve and graph quadratic equations, including y = -x². It is useful for verifying solutions and understanding graphical representations.
Video hướng dẫn vẽ đồ thị hàm số x bình phương âm, rất hữu ích cho học sinh và sinh viên học toán.
Đồ Thị Dạng Bình Phương Hoàn Chỉnh (2 trong 2) - Hàm Số x Bình Phương Âm
READ MORE:
Hướng dẫn nhanh cách vẽ đồ thị y = f(-x) khi f(x) = x^2 trong video này.
Nhanh nào! Vẽ đồ thị y=f(-x) cho f(x)=x bình phương


:max_bytes(150000):strip_icc()/Chi-SquareStatistic_Final_4199464-7eebcd71a4bf4d9ca1a88d278845e674.jpg)