Topic square root graph example: The concept of square root functions and their graphical representations is crucial in mathematics. This article delves into the intricacies of graphing square root functions, exploring their properties, transformations, and practical examples. Whether you're a student or an enthusiast, you'll find valuable insights and easy-to-follow guidelines to master the art of graphing these functions.
Table of Content
- Square Root Function Graph Example
- Introduction
- Understanding the Square Root Function
- Graphing the Basic Square Root Function
- Domain and Range of Square Root Functions
- Transformations of Square Root Functions
- Examples and Practice Problems
- Graphing Complex Square Root Functions
- Common Mistakes and Tips
- Interactive Tools for Graphing
- YOUTUBE:
Square Root Function Graph Example
The square root function is a fundamental mathematical function with important properties and transformations. Below are detailed explanations, examples, and graphs to help understand how to graph square root functions and their transformations.
Basic Square Root Function
The basic square root function is defined as:
\( f(x) = \sqrt{x} \)
- Domain: \([0, \infty)\)
- Range: \([0, \infty)\)
- Critical Point: (0, 0)
The graph of the basic square root function starts at the origin (0, 0) and arcs upwards, increasing at a decreasing rate.
Example of a Transformed Square Root Function
Consider the function \( f(x) = 2\sqrt{x + 1} + 7 \). This function includes vertical and horizontal transformations.
- Domain: \([-1, \infty)\)
- Range: \([7, \infty)\)
The transformation involves a vertical stretch by a factor of 2, a shift left by 1 unit, and a shift up by 7 units.
| x | f(x) |
|---|---|
| 0 | 9 |
| 3 | 11 |
| 8 | 13 |
| -1 | 7 |
Graphing a Square Root Function
- Identify the transformations from the parent function \( y = \sqrt{x} \).
- Determine the domain and range based on the transformations.
- Plot key points to understand the shape of the graph.
- Draw the graph starting from the critical point and applying transformations.
Example of a Complex Square Root Function
Consider the function \( f(x) = \sqrt{-x^2 + 4} \). This function includes a reflection and quadratic component under the square root.
- Domain: \([-2, 2]\)
- Range: \([0, 2]\)
The graph of this function represents the upper half of a circle centered at the origin with radius 2.
Understanding these examples and their transformations will help in graphing any square root function effectively.
READ MORE:
Introduction
The square root function, denoted as \( f(x) = \sqrt{x} \), is a fundamental mathematical function with applications in various fields. Its graph is a curve that starts at the origin (0,0) and increases gradually as x increases. Understanding how to graph this function and its transformations is crucial for solving numerous algebraic and geometric problems.
The square root function has some key properties:
- Domain: \( [0, \infty) \)
- Range: \( [0, \infty) \)
- It is an increasing function
- It has a minimum point at (0,0)
When graphing the square root function, it's important to consider transformations such as translations, reflections, and dilations. These transformations can be applied to the parent function \( f(x) = \sqrt{x} \) to create functions of the form \( f(x) = a\sqrt{b(x - h)} + k \), where:
- \( a \) affects the vertical stretch or compression
- \( b \) affects the horizontal stretch or compression
- \( h \) translates the graph horizontally
- \( k \) translates the graph vertically
To graph a square root function, follow these steps:
- Determine the domain by setting the radicand (expression under the square root) greater than or equal to zero and solving for x.
- Create a table of values (T-chart) for x within the domain and calculate corresponding y values.
- Plot the points on a coordinate plane.
- Draw a smooth curve through the plotted points, starting from the minimum point.
Exploring the square root function interactively by adjusting parameters \( a, b, h, \) and \( k \) can help in understanding its behavior and characteristics. Graphical tools and software can provide visual insights into how these transformations affect the graph.
Understanding the Square Root Function
The square root function, denoted as \( f(x) = \sqrt{x} \), is a fundamental mathematical concept with wide applications. This function maps a non-negative input \( x \) to a non-negative output \( y \), such that \( y \) is the number whose square equals \( x \). The square root function is continuous and only defined for \( x \ge 0 \), reflecting its domain.
The graph of the square root function is characterized by a gentle curve that starts at the origin (0,0) and increases gradually as \( x \) increases. This makes it an increasing function throughout its domain. Here are some key points to understand:
- Domain and Range: The domain of \( f(x) = \sqrt{x} \) is \([0, \infty)\), and its range is also \([0, \infty)\). This means the function accepts all non-negative real numbers as inputs and produces non-negative real numbers as outputs.
- Intercepts: The function intersects the origin, which is the only intercept on both axes.
- Behavior: As \( x \) approaches infinity, \( f(x) \) also increases but at a decreasing rate. This means the curve flattens out as \( x \) gets larger.
- Transformations: The general form \( f(x) = a\sqrt{b(x - h)} + k \) includes parameters that shift and stretch the graph:
- Vertical Shift: Changing \( k \) shifts the graph up or down.
- Horizontal Shift: Changing \( h \) shifts the graph left or right.
- Vertical Stretch/Shrink: Changing \( a \) stretches or shrinks the graph vertically.
- Horizontal Stretch/Shrink: Changing \( b \) affects the horizontal stretch or compression.
To illustrate, consider the function \( f(x) = 2\sqrt{x - 1} + 3 \). This graph is shifted 1 unit to the right and 3 units up, and it is stretched vertically by a factor of 2. Understanding these transformations helps in graphing and interpreting square root functions effectively.
Graphing the Basic Square Root Function
The square root function is one of the fundamental functions in mathematics, represented as \( f(x) = \sqrt{x} \). In this section, we will learn how to graph the basic square root function step by step.
Step-by-Step Guide to Graphing \( f(x) = \sqrt{x} \)
-
Understand the Shape of the Graph: The graph of \( f(x) = \sqrt{x} \) starts at the origin (0,0) and increases slowly at first, then more rapidly as x increases. The curve is always in the first quadrant of the coordinate plane.
-
Plot Key Points: Identify and plot key points that are easy to calculate and will help in sketching the graph. Some key points for \( f(x) = \sqrt{x} \) include:
- (0, 0)
- (1, 1)
- (4, 2)
- (9, 3)
- (16, 4)
-
Draw the Curve: Connect the points with a smooth curve. Remember, the graph will only exist in the first quadrant because the square root of a negative number is not defined in the set of real numbers.
-
Domain and Range: The domain of \( f(x) = \sqrt{x} \) is \( x \geq 0 \), and the range is \( y \geq 0 \). This means the graph will only include non-negative x and y values.
Graph Visualization
Below is a basic visualization of the square root function:
Using a Graphing Calculator
To confirm your graph, you can use a graphing calculator or online graphing tool. Enter the function \( f(x) = \sqrt{x} \) and observe the generated graph to ensure it matches your hand-drawn graph.
Example Problem
Example: Plot the function \( f(x) = \sqrt{x} \) for \( x \) values from 0 to 9.
Solution:
- At \( x = 0 \), \( f(x) = \sqrt{0} = 0 \)
- At \( x = 1 \), \( f(x) = \sqrt{1} = 1 \)
- At \( x = 4 \), \( f(x) = \sqrt{4} = 2 \)
- At \( x = 9 \), \( f(x) = \sqrt{9} = 3 \)
Plot these points and draw a smooth curve through them to visualize the function.
Domain and Range of Square Root Functions
Understanding the domain and range of square root functions is crucial for correctly graphing and analyzing these functions. In this section, we will explore the domain and range of the basic square root function \( f(x) = \sqrt{x} \) and how to determine them for more complex square root functions.
Domain of \( f(x) = \sqrt{x} \)
The domain of a function is the set of all possible input values (x-values) for which the function is defined. For the square root function \( f(x) = \sqrt{x} \), the function is only defined when the expression inside the square root is non-negative.
Therefore, the domain of \( f(x) = \sqrt{x} \) is all non-negative real numbers. In mathematical notation, this is written as:
Range of \( f(x) = \sqrt{x} \)
The range of a function is the set of all possible output values (y-values). For the square root function \( f(x) = \sqrt{x} \), the output is the square root of the input value. Since the square root of a non-negative number is also non-negative, the range of \( f(x) = \sqrt{x} \) is all non-negative real numbers. In mathematical notation, this is written as:
Domain and Range of Transformed Square Root Functions
When dealing with transformations of the square root function, such as horizontal shifts, vertical shifts, stretches, and compressions, the domain and range can change. Consider the function \( g(x) = a \sqrt{b(x - h)} + k \). The steps to determine the domain and range are as follows:
-
Identify the Horizontal Shift (h): The function will be shifted horizontally by \( h \) units. The domain will be affected by this shift.
-
Determine the Domain: Solve the inequality \( b(x - h) \geq 0 \) to find the domain. If \( b \) is positive, the domain is \( x \geq h \). If \( b \) is negative, the domain is \( x \leq h \).
-
Identify the Vertical Shift (k): The function will be shifted vertically by \( k \) units. The range will be affected by this shift.
-
Determine the Range: The range will be \( y \geq k \) if \( a \) is positive, and \( y \leq k \) if \( a \) is negative.
Example Problem
Example: Determine the domain and range of the function \( h(x) = 2 \sqrt{x - 3} + 1 \).
Solution:
- Domain: Solve the inequality \( x - 3 \geq 0 \):
- \( x \geq 3 \)
Thus, the domain is \( \{ x | x \geq 3 \} \).
- Range: Since the vertical shift is 1 and the coefficient 2 is positive:
- \( y \geq 1 \)
Thus, the range is \( \{ y | y \geq 1 \} \).

Transformations of Square Root Functions
Transformations of the square root function involve shifting, reflecting, stretching, and compressing the basic graph of \( f(x) = \sqrt{x} \). Understanding these transformations helps in graphing more complex square root functions. The general form of a transformed square root function is:
1. Horizontal Shifts
A horizontal shift moves the graph left or right. In the function \( y = \sqrt{x - h} \), the graph shifts to the right by \( h \) units if \( h \) is positive, and to the left by \( h \) units if \( h \) is negative.
2. Vertical Shifts
A vertical shift moves the graph up or down. In the function \( y = \sqrt{x} + k \), the graph shifts up by \( k \) units if \( k \) is positive, and down by \( k \) units if \( k \) is negative.
3. Reflections
Reflections flip the graph across an axis. In the function \( y = -\sqrt{x} \), the graph is reflected over the x-axis, producing a mirror image below the x-axis.
4. Vertical Stretching and Compressing
Vertical stretching and compressing change the steepness of the graph. In the function \( y = a\sqrt{x} \), the graph stretches vertically if \( |a| > 1 \) and compresses if \( 0 < |a| < 1 \). If \( a \) is negative, there is also a reflection over the x-axis.
Example: Transforming \( y = \sqrt{x} \)
Let's transform the basic function \( y = \sqrt{x} \) with the function \( y = 2\sqrt{x - 3} + 1 \):
- Horizontal shift: The term \( x - 3 \) indicates a shift 3 units to the right.
- Vertical stretch: The coefficient 2 indicates a vertical stretch by a factor of 2.
- Vertical shift: The term \( + 1 \) indicates a shift 1 unit up.
Combining these transformations, the graph of \( y = 2\sqrt{x - 3} + 1 \) starts at the point (3, 1) and rises more steeply than the basic square root function.
Steps to Graph the Transformed Function
- Start with the parent function: Begin with the graph of \( y = \sqrt{x} \).
- Apply the horizontal shift: Shift the graph to the right by 3 units.
- Apply the vertical stretch: Stretch the graph vertically by a factor of 2.
- Apply the vertical shift: Shift the graph up by 1 unit.
Practice Problems
- Graph the function \( y = \sqrt{x + 2} - 3 \).
- Determine the transformations applied to \( y = -\sqrt{2x - 4} + 5 \).
Examples and Practice Problems
In this section, we will explore several examples and practice problems to help you understand how to graph square root functions. We will cover basic examples and progressively move to more complex problems.
Example 1: Basic Square Root Function
Consider the basic square root function:
\( f(x) = \sqrt{x} \)
To graph this function, we can create a table of values:
| x | f(x) = \(\sqrt{x}\) |
|---|---|
| 0 | 0 |
| 1 | 1 |
| 4 | 2 |
| 9 | 3 |
| 16 | 4 |
Using these points, plot the graph, which will start at the origin (0,0) and curve upwards.
Example 2: Vertical and Horizontal Shifts
Consider the function:
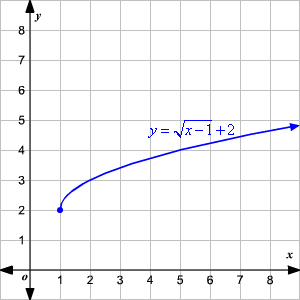
\( f(x) = \sqrt{x - 2} + 3 \)
This function involves a horizontal shift to the right by 2 units and a vertical shift up by 3 units. Create a table of values:
| x | f(x) = \(\sqrt{x - 2} + 3\) |
|---|---|
| 2 | 3 |
| 3 | 4 |
| 6 | 5 |
| 11 | 6 |
Plot these points and join them with a smooth curve.
Example 3: Reflections and Stretching
Consider the function:
\( f(x) = -2\sqrt{x} \)
This function reflects the graph of \( \sqrt{x} \) across the x-axis and stretches it vertically by a factor of 2. Create a table of values:
| x | f(x) = -2\(\sqrt{x}\) |
|---|---|
| 0 | 0 |
| 1 | -2 |
| 4 | -4 |
| 9 | -6 |
Plot these points and connect them to see the transformed graph.
Practice Problems
-
Graph the function \( f(x) = \sqrt{x + 1} - 2 \). Determine the domain and range.
-
Graph the function \( f(x) = \sqrt{2x - 4} + 1 \). Identify the shifts and the domain and range.
-
Graph the function \( f(x) = -\sqrt{0.5x} \). Describe the transformations applied to the parent function \( \sqrt{x} \).
By practicing these problems, you'll gain a deeper understanding of how different transformations affect the graph of square root functions.
Graphing Complex Square Root Functions
Graphing complex square root functions involves a series of steps to ensure accurate representation. Below is a detailed guide to graphing such functions:
-
Identify the Function and its Domain:
Consider the function \( f(x) = \sqrt{ax + b} \). First, determine the domain by setting the expression under the square root greater than or equal to zero.
For example, for \( f(x) = \sqrt{3 - x} \):
- Set the inequality: \( 3 - x \geq 0 \)
- Solve for \( x \): \( x \leq 3 \)
Thus, the domain is \( x \leq 3 \).
-
Create a Table of Values:
Select values of \( x \) within the domain and compute the corresponding \( y \) values.
x \( \sqrt{3 - x} \) 3 0 2 1 0 \( \sqrt{3} \approx 1.73 \) -1 2 -
Plot the Points:
Using a graphing tool or graph paper, plot the points from the table on a coordinate plane. Ensure you mark the endpoint and the boundary clearly.
-
Draw the Curve:
Connect the points smoothly to form the graph of the square root function. The curve should start at the boundary point and extend to the left.
Remember that the graph of \( \sqrt{3 - x} \) starts at \( (3, 0) \) and arcs leftward, growing slowly upwards.
-
Verify the Range:
The range of the function is determined by the values that \( y \) can take. For \( f(x) = \sqrt{3 - x} \), as \( x \) decreases, \( y \) increases without bound.
Hence, the range is \( y \geq 0 \).
Let's consider another example to illustrate a more complex function, \( f(x) = -\sqrt{-2x + 4} + 1 \).
-
Identify the Domain:
- Set the inequality: \( -2x + 4 \geq 0 \)
- Solve for \( x \): \( x \leq 2 \)
Thus, the domain is \( x \leq 2 \).
-
Create a Table of Values:
x \( -\sqrt{-2x + 4} + 1 \) 2 1 1.5 0 0 -1 -1 -2 -
Plot the Points:
Plot the points on the coordinate plane.
-
Draw the Curve:
Connect the points to form the graph. Note that this function produces a curve that descends as \( x \) increases.
-
Verify the Range:
The range of this function is \( y \leq 1 \), as the highest point on the graph is at \( y = 1 \).
By following these steps, you can accurately graph complex square root functions and understand their properties.
Common Mistakes and Tips
When working with square root functions, it's common to encounter certain mistakes. Here are some common errors and tips to avoid them:
Common Mistakes
-
Incorrect simplification: It's incorrect to write \( \sqrt{25} = \pm 5 \). The square root function has only one output, which is the positive root.
Correct: \( \sqrt{25} = 5 \)
-
Misunderstanding the absolute value: Writing \( \sqrt{x^2} = x \) is incorrect because the output of the square root is non-negative.
Correct: \( \sqrt{x^2} = |x| \)
-
Confusing domain restrictions: Assuming that the domain of \( \sqrt{x - c} \) includes all real numbers is a mistake. The correct domain is \( x \ge c \).
Tips for Avoiding Mistakes
-
Understand the Domain and Range: The domain of \( f(x) = \sqrt{x} \) is \( x \ge 0 \) and the range is \( y \ge 0 \). For transformations, adjust these accordingly.
-
Check Your Transformations: When dealing with transformations like \( f(x) = a \sqrt{x - c} + d \), ensure you correctly apply shifts and scalings. Horizontal shifts depend on \( c \), vertical shifts on \( d \), and the vertical stretch/compression on \( a \).
-
Use Graphing Tools: Utilize graphing calculators or software to visualize square root functions and confirm your calculations.
Examples
Consider the function \( f(x) = \sqrt{x - 2} + 3 \). Let's identify the domain and range, and then graph it.
-
Domain: Since the expression under the square root must be non-negative, \( x - 2 \ge 0 \) which simplifies to \( x \ge 2 \).
-
Range: The smallest value of \( \sqrt{x - 2} \) is 0 (when \( x = 2 \)). Thus, the range starts at \( 3 \) (since \( 0 + 3 = 3 \)) and extends to infinity.
-
Graph: Plot the basic square root function, then shift it right by 2 units and up by 3 units.
This careful step-by-step approach helps avoid common pitfalls and ensures accurate graphing and analysis of square root functions.

Interactive Tools for Graphing
Graphing square root functions can be greatly enhanced with the use of interactive tools. These tools allow users to visualize transformations and better understand the properties of square root graphs. Here are some recommended interactive tools:
-
Desmos Graphing Calculator:
Desmos is a popular online graphing calculator that provides an intuitive platform for graphing functions, including square root functions. Users can easily input functions, apply transformations, and observe changes in real-time.
Steps to use Desmos for graphing square root functions:
- Go to the website.
- In the input field, type the square root function you want to graph, such as
sqrt(x). - To apply transformations, modify the function (e.g.,
sqrt(x - 2) + 3) and see the graph update instantly. - Use the tools provided to zoom in, zoom out, and adjust the viewing window as needed.
-
GeoGebra:
GeoGebra is another powerful tool for graphing and exploring mathematical concepts. It offers dynamic graphing capabilities and interactive features that make learning and teaching mathematics more engaging.
Steps to use GeoGebra for graphing square root functions:
- Visit the page.
- Enter the square root function in the input bar, such as
y = sqrt(x). - To apply transformations, modify the function (e.g.,
y = sqrt(x + 1) - 2) and observe the changes on the graph. - Utilize the various tools and features to analyze the graph and perform additional operations.
-
Mathway:
Mathway is an online math solver that can also graph functions. It is user-friendly and provides step-by-step solutions to mathematical problems, including graphing functions.
Steps to use Mathway for graphing square root functions:
- Navigate to the website.
- Input the square root function you wish to graph, such as
sqrt(x). - Click on the graph icon to visualize the function.
- To see transformations, adjust the function (e.g.,
sqrt(x - 3) + 4) and view the updated graph.
These tools not only make graphing easier but also provide interactive learning experiences that can deepen your understanding of square root functions and their transformations. Experimenting with different functions and transformations using these tools can help reinforce key concepts and improve problem-solving skills.
Vẽ Đồ Thị Hàm Số Căn Bậc Hai Bằng Biến Đổi & Vẽ Điểm
READ MORE:
Cách Vẽ Phương Trình Hàm Số Căn Bậc Hai

