Topic square root graph equation: The square root graph equation is essential in mathematics for visualizing how square root functions behave. This article will guide you through the process of graphing square root functions, understanding their domains and ranges, and applying transformations. With clear explanations and examples, you'll gain a solid understanding of how to work with these functions effectively.
Table of Content
- Square Root Graph Equation
- Introduction to Square Root Functions
- Understanding the Square Root Function
- Properties of the Square Root Function
- Domain and Range
- Graphing Square Root Functions
- Transformations of Square Root Graphs
- Common Examples and Exercises
- Interactive Tools for Learning
- Frequently Asked Questions
- YOUTUBE: Hãy xem video về cách vẽ biểu đồ của các hàm căn bậc hai bằng cách sử dụng biến đổi và đánh điểm để hiểu rõ hơn về đề tài biểu đồ hàm căn bậc hai.
Square Root Graph Equation
The square root function is typically represented as \( f(x) = \sqrt{x} \). It is important in mathematics because it helps in understanding the relationship between numbers and their roots. This guide provides a detailed overview of how to graph square root functions, including their properties and examples.
Graph of Square Root Function
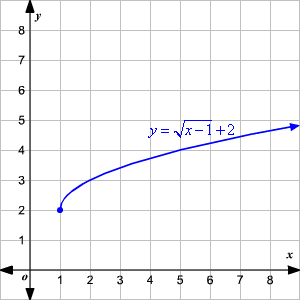
The graph of the square root function \( f(x) = \sqrt{x} \) is a curve that starts from the origin (0, 0) and extends infinitely to the right, always increasing but at a decreasing rate. The basic shape of this curve is determined by its properties:
- The domain of \( f(x) = \sqrt{x} \) is \( [0, \infty) \).
- The range of \( f(x) = \sqrt{x} \) is \( [0, \infty) \).
- The function increases throughout its domain.
- There are no asymptotes or relative maxima.
- The minimum value is at the origin, (0, 0).
Steps to Graph Square Root Functions
- Find the domain: Solve for the values of \( x \) where the expression inside the square root is non-negative.
- Create a table of values (T-chart): Select \( x \)-values within the domain and compute corresponding \( y \)-values.
- Plot the points: Use the T-chart to plot points on the coordinate plane.
- Draw the curve: Connect the points smoothly to form the graph of the function.
Example
Consider the function \( f(x) = 2\sqrt{x - 1} + 3 \). To graph this function:
- Domain: \( x - 1 \geq 0 \implies x \geq 1 \).
- Range: Since the minimum value of \( 2\sqrt{x - 1} \) is 0, the minimum value of \( f(x) \) is 3. Hence, the range is \( [3, \infty) \).
Using the T-chart:
| \( x \) | \( y = 2\sqrt{x - 1} + 3 \) |
| 1 | 3 |
| 2 | 5 |
| 5 | 7 |
| 10 | 9 |
Plot these points and draw the smooth curve through them to get the graph of the function.
Transformations of Square Root Functions
The parent square root function \( f(x) = \sqrt{x} \) can be transformed into various forms such as \( f(x) = a\sqrt{b(x - h)} + k \), where:
- \( a \) affects the vertical stretch or compression and reflection.
- \( b \) affects the horizontal stretch or compression and reflection.
- \( h \) translates the graph horizontally.
- \( k \) translates the graph vertically.
These transformations can be applied to adjust the graph as needed for specific applications.
Conclusion
Understanding the graph of the square root function and its transformations is essential in various fields of mathematics and applied sciences. By following the steps outlined above, you can accurately graph any square root function and interpret its properties.
READ MORE:
Introduction to Square Root Functions
The square root function is one of the fundamental mathematical functions used in various fields. It is defined as f(x) = √x, where x is a non-negative number. The graph of the square root function forms a curve that starts at the origin (0,0) and extends infinitely to the right. This function is unique in that it only produces non-negative outputs for non-negative inputs.
- Domain: The domain of the square root function is all non-negative real numbers, expressed as [0, ∞).
- Range: The range of the square root function is also all non-negative real numbers, [0, ∞).
- Graph Characteristics: The graph of f(x) = √x is a half-parabola that increases at a decreasing rate, indicating that as x gets larger, the rate of increase of f(x) slows down.
Understanding the properties and graph of the square root function is crucial for solving various mathematical problems and applications in science and engineering.
Understanding the Square Root Function
The square root function is a fundamental mathematical concept with the general form \( f(x) = \sqrt{x} \). This function is defined for all non-negative values of \( x \), as the square root of a negative number is not a real number.
Key characteristics of the square root function include:
- Domain: \( [0, \infty) \) - The function is defined for all \( x \geq 0 \).
- Range: \( [0, \infty) \) - The output of the function is also non-negative.
- Intercept: The graph passes through the origin (0,0).
- Shape: The graph is a curve that starts at the origin and increases slowly, creating a characteristic arc.
To graph the square root function, follow these steps:
- Determine the domain: Ensure all values inside the square root are non-negative.
- Create a T-chart: Select a range of \( x \) values within the domain and calculate the corresponding \( y \) values using \( f(x) = \sqrt{x} \).
- Plot the points: Plot the calculated points on a graph.
- Draw the curve: Connect the points smoothly to form the characteristic square root curve.
Example:
| x | 0 | 1 | 4 | 9 |
| y = √x | 0 | 1 | 2 | 3 |
Graph these points and connect them to visualize the function. The square root function increases at a decreasing rate, making it slower to rise as \( x \) becomes larger.
Understanding the transformations of the square root function is also crucial:
- Vertical shifts: \( f(x) = \sqrt{x} + c \) shifts the graph up or down.
- Horizontal shifts: \( f(x) = \sqrt{x - c} \) shifts the graph left or right.
- Reflections: \( f(x) = -\sqrt{x} \) reflects the graph across the x-axis.
- Stretching/Compressing: \( f(x) = a\sqrt{x} \) scales the graph vertically.
These transformations help in understanding more complex functions derived from the basic square root function.
Properties of the Square Root Function
The square root function, represented as \( f(x) = \sqrt{x} \), has unique properties that distinguish it from other functions. Understanding these properties is essential for graphing and analyzing the function.
- Domain: The domain of \( f(x) = \sqrt{x} \) is \( [0, \infty) \). This means that the function is defined for all non-negative values of \( x \).
- Range: The range of the square root function is also \( [0, \infty) \). The function outputs only non-negative values.
- Intercepts: The graph of \( f(x) = \sqrt{x} \) intersects the y-axis at (0, 0). This is the only intercept since the function does not produce negative values.
- Behavior: The square root function is an increasing function. As \( x \) increases, \( f(x) \) also increases, but at a decreasing rate.
- Shape: The graph of \( f(x) = \sqrt{x} \) starts at the origin (0, 0) and arcs upward, becoming flatter as \( x \) increases.
- End Behavior: As \( x \) approaches infinity, \( f(x) \) also approaches infinity, indicating that the function continues to increase without bound.
- Critical Points: The critical point of the function is at (0, 0), where the function has its minimum value. There are no inflection points.
- Asymptotes: The square root function does not have any horizontal or vertical asymptotes.
These properties help in plotting the graph of the square root function accurately and understanding its behavior in different mathematical contexts.
Domain and Range
The domain and range of the square root function \(f(x) = \sqrt{x}\) are fundamental concepts in understanding its behavior.
- Domain: The domain of the square root function includes all non-negative real numbers. This is because the square root of a negative number is not defined in the set of real numbers. Mathematically, the domain is expressed as \( [0, \infty) \).
- Range: The range of the square root function is also all non-negative real numbers. Since the square root function outputs only non-negative values, it means that \( f(x) = \sqrt{x} \) will always yield a result greater than or equal to zero. The range is therefore \( [0, \infty) \).
In a graphical representation, the square root function starts at the origin (0,0) and increases indefinitely to the right. There are no negative y-values in the range because square roots of positive numbers are always positive. This property of the square root function ensures that both the domain and range are constrained to non-negative values.
Here is a simple example to illustrate:
| x | f(x) = √x |
|---|---|
| 0 | 0 |
| 1 | 1 |
| 4 | 2 |
| 9 | 3 |
From this table, it's clear that as \( x \) increases, \( \sqrt{x} \) also increases, reinforcing the non-negative nature of both the domain and range.

Graphing Square Root Functions
The square root function, represented as \( f(x) = \sqrt{x} \), produces a graph that starts at the origin (0,0) and extends to the right, gradually increasing in height. This guide will provide a step-by-step approach to graphing square root functions, including transformations and key properties.
- Step 1: Identify the parent function \( f(x) = \sqrt{x} \).
- Step 2: Determine any transformations such as translations, reflections, and dilations.
- Step 3: Plot key points by choosing values for \( x \) and calculating \( y \).
- Step 4: Draw the graph by connecting the plotted points smoothly.
Let's break down the graphing process:
-
Start with the basic function \( f(x) = \sqrt{x} \). The graph begins at the origin (0, 0) and moves upwards to the right.
x 0 1 4 9 y = \(\sqrt{x}\) 0 1 2 3 -
Apply transformations if given a modified function such as \( f(x) = a\sqrt{b(x - h)} + k \). Here’s how each parameter affects the graph:
- \( a \) - Vertical stretch or compression and reflection across the x-axis if negative.
- \( b \) - Horizontal stretch or compression and reflection across the y-axis if negative.
- \( h \) - Horizontal translation (shift left/right).
- \( k \) - Vertical translation (shift up/down).
-
Example: For \( f(x) = \sqrt{x - 2} + 3 \), the graph shifts right by 2 units and up by 3 units. Calculate and plot key points:
x 2 3 6 11 y = \(\sqrt{x - 2} + 3\) 3 4 5 6 -
Connect the points to form the graph of the square root function.
Remember, the square root function's graph always increases, but at a decreasing rate, and is defined for \( x \geq 0 \) in its basic form.
Transformations of Square Root Graphs
Transformations of square root graphs involve modifying the basic square root function \( y = \sqrt{x} \) to reflect shifts, stretches, compressions, and reflections. These transformations can be represented algebraically and visually on the coordinate plane.
Here are the key transformations:
- Vertical Shift: \( y = \sqrt{x} + k \) shifts the graph vertically by \( k \) units.
- Horizontal Shift: \( y = \sqrt{x+h} \) shifts the graph horizontally by \( h \) units.
- Vertical Stretch/Compression: \( y = a\sqrt{x} \) stretches or compresses the graph vertically by a factor of \( |a| \).
- Reflection: \( y = -\sqrt{x} \) reflects the graph across the x-axis.
These transformations allow us to manipulate the position and shape of the square root graph to fit different scenarios and mathematical models.
Common Examples and Exercises
Here are some common examples and exercises involving square root graphs:
- Graph the function \( y = \sqrt{x} \) on a coordinate plane.
- Apply a vertical shift to the graph of \( y = \sqrt{x} \) by \( k = 2 \).
- Graph \( y = \sqrt{x+3} \) and determine its horizontal shift.
- Explore the effect of different values of \( a \) in \( y = a\sqrt{x} \) on the vertical stretch or compression of the graph.
- Reflect the graph of \( y = \sqrt{x} \) across the x-axis and analyze the changes.
These exercises will help you understand and practice the fundamental concepts of square root graphs, including transformations and their graphical representations.
Interactive Tools for Learning
Exploring square root functions can be greatly enhanced through interactive tools that provide visualizations and simulations. Below are some useful tools:
- : This versatile tool allows users to graph square root functions dynamically and explore transformations.
- : Another powerful calculator that supports graphing square root functions with options for sliders to manipulate parameters.
- : While not solely a graphing tool, Wolfram Alpha can compute and graph square root functions based on input equations or queries.
- : Offers detailed graphing of square root functions along with step-by-step solutions and interpretations.
These tools are designed to assist both learners and educators in visualizing and understanding the behavior of square root functions in various contexts.

Frequently Asked Questions
Here are some common questions about square root graph equations:
- What does the graph of a square root function look like?
- How do you find the domain and range of a square root function?
- What are the key properties of square root graphs?
- How do you graph transformations of square root functions?
- What are some real-life applications of square root functions?
Exploring these questions can provide a deeper understanding of square root functions and their graphical representations.
Hãy xem video về cách vẽ biểu đồ của các hàm căn bậc hai bằng cách sử dụng biến đổi và đánh điểm để hiểu rõ hơn về đề tài biểu đồ hàm căn bậc hai.
Biểu Đồ Hàm Căn Bậc Hai Sử Dụng Biến Đổi & Đánh Điểm | Video Học
READ MORE:
Xem video hướng dẫn cách vẽ đồ thị của phương trình căn bậc hai để hiểu rõ hơn về đề tài biểu đồ hàm căn bậc hai.
Cách vẽ đồ thị của phương trình căn bậc hai | Video Hướng Dẫn
