Topic square root x graph: Discover the fundamentals of the square root function and how to graph it effectively. This comprehensive guide will walk you through the domain, range, transformations, and key properties of the square root function, providing clear examples and practice problems to enhance your understanding and avoid common mistakes.
Table of Content
- Graph of the Square Root Function
- Introduction to Square Root Functions
- Understanding the Domain and Range
- Transformations of Square Root Functions
- Examples and Step-by-Step Graphing
- Common Mistakes and How to Avoid Them
- Practice Problems
- FAQs on Square Root Functions
- YOUTUBE: Đồ thị hàm căn bậc hai sử dụng phép biến đổi và đánh dấu điểm.
Graph of the Square Root Function
The graph of the square root function \( f(x) = \sqrt{x} \) is a fundamental concept in algebra. This function has several key properties and transformations that are important to understand.
Properties of the Square Root Function
- Domain: \([0, \infty)\)
- Range: \([0, \infty)\)
- It is an increasing function throughout its domain.
- Has a minimum point at \((0, 0)\).
- No relative maxima or asymptotes.
Graphing the Square Root Function
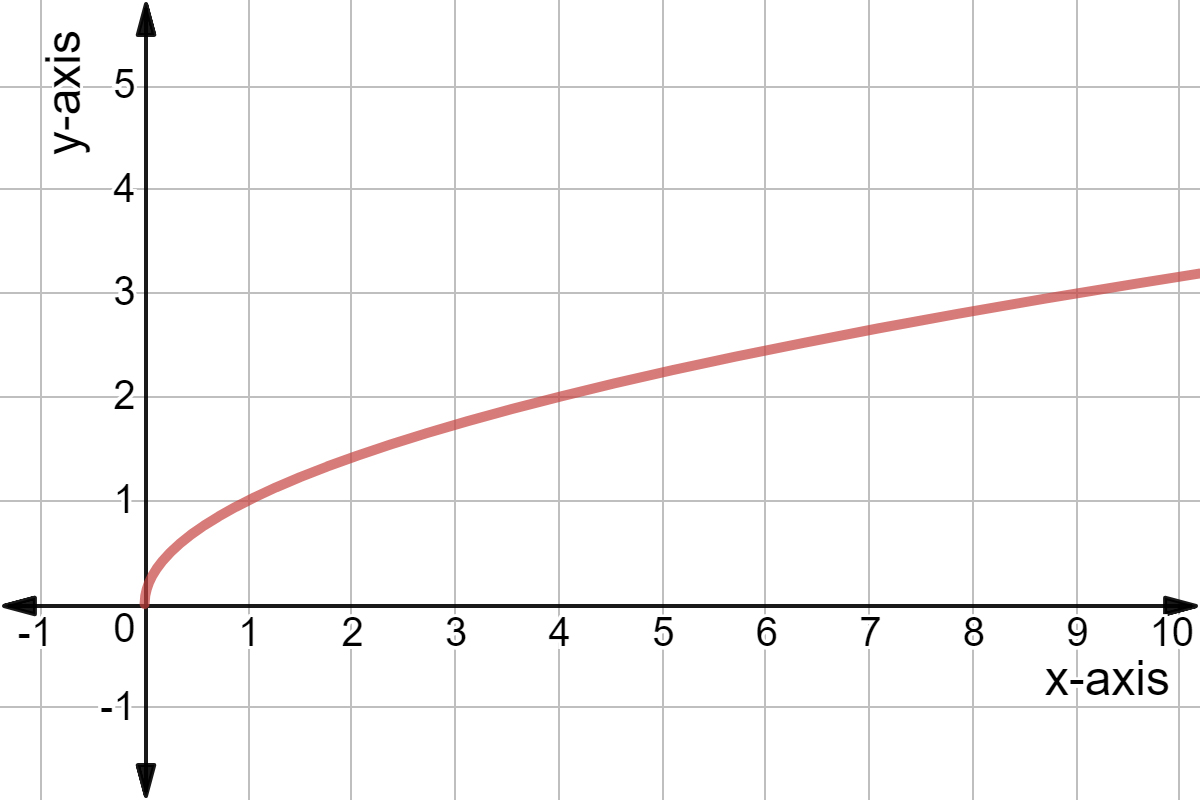
To graph \( f(x) = \sqrt{x} \), we start by plotting a few key points and then draw a smooth curve through them. Here is a step-by-step guide:
- Identify the domain: \( x \geq 0 \).
- Create a table of values:
- Plot the points \((0,0)\), \((1,1)\), \((4,2)\), and \((9,3)\).
- Draw a smooth curve through these points starting at the origin and increasing to the right.
| x | 0 | 1 | 4 | 9 |
| y | 0 | 1 | 2 | 3 |
Transformations of the Square Root Function
Square root functions can be transformed similarly to other functions. Here are a few examples:
- Vertical Shift: \( f(x) = \sqrt{x} + k \)
- Horizontal Shift: \( f(x) = \sqrt{x - h} \)
- Reflection: \( f(x) = -\sqrt{x} \)
- Vertical Stretch/Compression: \( f(x) = a\sqrt{x} \)
Example of a Transformed Function
Consider the function \( f(x) = \sqrt{x - 2} + 3 \). This function is shifted 2 units to the right and 3 units up. To graph this:
- Determine the new domain: \( x - 2 \geq 0 \Rightarrow x \geq 2 \).
- Create a table of values for \( x \geq 2 \):
- Plot the points \((2,3)\), \((3,4)\), \((6,5)\), and \((11,6)\).
- Draw a smooth curve through these points.
| x | 2 | 3 | 6 | 11 |
| y | 3 | 4 | 5 | 6 |
Visualizing the Square Root Function
You can use online graphing tools such as Desmos to visualize the square root function and its transformations.
READ MORE:
Introduction to Square Root Functions
The square root function is a fundamental mathematical function represented as or f(x) = √x. It is essential in various fields, including algebra, calculus, and real-world applications.
Key characteristics of the square root function include:
- Domain: The set of all non-negative real numbers,
[0, ∞). - Range: The set of all non-negative real numbers,
[0, ∞).
The graph of the square root function is a curve that starts at the origin (0,0) and increases gradually. Here are some important points to consider:
- Starting Point: The graph starts at (0,0), where both the input and output are zero.
- Shape: The graph is a half-parabola that opens to the right.
- Continuity: The function is continuous for all values within its domain.
Let's look at the basic properties of the square root function in a tabular format:
| x | f(x) = √x |
|---|---|
| 0 | 0 |
| 1 | 1 |
| 4 | 2 |
| 9 | 3 |
Understanding the square root function's graph helps in visualizing how it behaves and can be transformed in different mathematical problems. This foundational knowledge is crucial for mastering more advanced topics.
Understanding the Domain and Range
The domain and range of a function are crucial concepts that define where the function is applicable and what values it can take. For the square root function or f(x) = √x, understanding these aspects is essential.
Domain: The domain of the square root function is the set of all non-negative real numbers. This is because the square root of a negative number is not defined in the set of real numbers. Mathematically, the domain is expressed as:
In interval notation, this is written as [0, ∞).
Range: The range of the square root function is also the set of all non-negative real numbers. This is because the output of the square root function is always non-negative. Mathematically, the range is expressed as:
In interval notation, this is written as [0, ∞).
To summarize:
| Aspect | Mathematical Expression | Interval Notation |
|---|---|---|
| Domain | [0, ∞) | |
| Range | [0, ∞) |
Understanding the domain and range of the square root function helps in accurately graphing the function and solving related mathematical problems.
Transformations of Square Root Functions
Transformations of the square root function involve shifting, stretching, compressing, and reflecting the graph. These transformations can be applied to the basic function f(x) = √x to obtain various forms.
Here are the main types of transformations:
- Vertical Shifts: Adding or subtracting a constant k moves the graph up or down.
- Equation:
- Example:
f(x) = √x + 2shifts the graph 2 units up.
- Horizontal Shifts: Adding or subtracting a constant h inside the square root shifts the graph left or right.
- Equation:
- Example:
f(x) = √(x - 3)shifts the graph 3 units to the right.
- Vertical Stretching and Compressing: Multiplying the function by a constant a stretches or compresses the graph vertically.
- Equation:
- Example:
f(x) = 2√xstretches the graph by a factor of 2.
- Horizontal Stretching and Compressing: Multiplying the variable inside the square root by a constant b stretches or compresses the graph horizontally.
- Equation:
- Example:
f(x) = √(2x)compresses the graph horizontally by a factor of 2.
- Reflections: Reflecting the graph across the x-axis or y-axis.
- Across the x-axis:
- Across the y-axis:
Let's summarize these transformations in a table:
| Transformation | Equation | Effect |
|---|---|---|
| Vertical Shift | Moves graph up or down | |
| Horizontal Shift | Moves graph left or right | |
| Vertical Stretch/Compress | Stretches or compresses vertically | |
| Horizontal Stretch/Compress | Stretches or compresses horizontally | |
| Reflection | or | Reflects across axes |
By understanding and applying these transformations, you can manipulate the square root function to fit various mathematical contexts and problems.
Examples and Step-by-Step Graphing
Graphing the square root function can be straightforward when following a step-by-step approach. Here, we will graph f(x) = √x and provide examples with transformations.
Basic Graph of f(x) = √x
- Select Key Points: Choose a few values of x and calculate the corresponding y values.
x f(x) = √x 0 0 1 1 4 2 9 3 - Plot the Points: On a coordinate plane, plot the points (0,0), (1,1), (4,2), and (9,3).
- Draw the Curve: Connect the points with a smooth, continuous curve that starts at the origin and increases to the right.
Example: Vertical Shift
Let's graph f(x) = √x + 2.
- Select Key Points: Choose a few values of x and calculate the corresponding y values.
x f(x) = √x + 2 0 2 1 3 4 4 9 5 - Plot the Points: On a coordinate plane, plot the points (0,2), (1,3), (4,4), and (9,5).
- Draw the Curve: Connect the points with a smooth curve that shifts the basic graph of
√xup by 2 units.
Example: Horizontal Shift
Let's graph f(x) = √(x - 3).
- Select Key Points: Choose a few values of x and calculate the corresponding y values.
x f(x) = √(x - 3) 3 0 4 1 7 2 12 3 - Plot the Points: On a coordinate plane, plot the points (3,0), (4,1), (7,2), and (12,3).
- Draw the Curve: Connect the points with a smooth curve that shifts the basic graph of
√xto the right by 3 units.
By following these examples and steps, you can graph various forms of the square root function and understand how transformations affect their graphs.
Common Mistakes and How to Avoid Them
When graphing or working with the square root function , it's common to encounter some errors. Here are typical mistakes and tips on how to avoid them:
Mistake 1: Ignoring the Domain
Issue: Plotting points for negative values of x.
Solution: Remember that the square root function is only defined for x ≥ 0. Always choose non-negative values for x when plotting.
Mistake 2: Misinterpreting Transformations
Issue: Incorrectly applying vertical or horizontal shifts.
Solution: Understand the rules for transformations:
- For
f(x) = √(x - h), the graph shifts h units to the right. - For
f(x) = √x + k, the graph shifts k units up. - Review transformations thoroughly before plotting.
Mistake 3: Incorrect Scaling
Issue: Failing to correctly apply vertical or horizontal stretches/compressions.
Solution:
- For vertical stretches/compressions:
f(x) = a√x, where a stretches if a > 1 and compresses if 0 < a < 1. - For horizontal stretches/compressions:
f(x) = √(bx), where b compresses if b > 1 and stretches if 0 < b < 1. - Practice transforming simple functions to build intuition.
Mistake 4: Overlooking the Range
Issue: Assuming the range includes negative values.
Solution:
- Remember that the output of
√xis always non-negative. - The range of the square root function is
[0, ∞).
Mistake 5: Plotting Without Key Points
Issue: Drawing the curve without calculating precise points.
Solution:
- Select key points such as (0,0), (1,1), (4,2), (9,3).
- Plot these points accurately to guide the shape of the curve.
Example Correction Table:
Below is a table highlighting some common mistakes and their corrections:
| Mistake | Explanation | Correction |
|---|---|---|
| Using negative x-values | Square root of negative numbers is undefined in the real number system. | Only use x-values in the domain [0, ∞). |
| Incorrect vertical shift | Misinterpreting +k as a shift down. |
Shift up for +k, down for -k. |
| Incorrect horizontal shift | Misinterpreting -h as a shift left. |
Shift right for -h, left for +h. |
| Ignoring scaling factors | Not applying a or b correctly in transformations. | Practice with a√x and √(bx) to understand scaling. |
| Assuming range includes negative values | The square root function cannot produce negative outputs. | Range is [0, ∞). |
By understanding these common mistakes and learning how to avoid them, you can more accurately graph and interpret the square root function.
Practice Problems
To solidify your understanding of graphing square root functions, try solving the following practice problems. Each problem includes step-by-step instructions to guide you through the process.
Problem 1: Basic Square Root Function
Graph f(x) = √x.
- Select Key Points: Choose several values of x and calculate corresponding y values.
x f(x) = √x 0 0 1 1 4 2 9 3 - Plot the Points: On graph paper, plot the points (0,0), (1,1), (4,2), and (9,3).
- Draw the Curve: Connect the points with a smooth curve starting from the origin.
Problem 2: Vertical Shift
Graph f(x) = √x + 3.
- Select Key Points: Calculate values of y for several x values.
x f(x) = √x + 3 0 3 1 4 4 5 9 6 - Plot the Points: Plot the points (0,3), (1,4), (4,5), and (9,6).
- Draw the Curve: Draw a smooth curve that is the graph of
√xshifted up by 3 units.
Problem 3: Horizontal Shift
Graph f(x) = √(x - 2).
- Select Key Points: Calculate values of y for several x values.
x f(x) = √(x - 2) 2 0 3 1 6 2 11 3 - Plot the Points: Plot the points (2,0), (3,1), (6,2), and (11,3).
- Draw the Curve: Draw a smooth curve that is the graph of
√xshifted to the right by 2 units.
Problem 4: Combining Transformations
Graph f(x) = 2√(x - 1) - 1.
- Select Key Points: Calculate values of y for several x values.
x f(x) = 2√(x - 1) - 1 1 -1 2 1 5 3 10 5 - Plot the Points: Plot the points (1,-1), (2,1), (5,3), and (10,5).
- Draw the Curve: Draw a smooth curve that represents the combined transformations of stretching, shifting right, and shifting down.
Practicing these problems will help you master the graphing of square root functions and understand how different transformations affect their shapes.
FAQs on Square Root Functions
1. What is the domain of the square root function?
The domain of the square root function is the set of all non-negative real numbers. Mathematically, this is written as [0, ∞). The function is undefined for negative values of x in the real number system.
2. What is the range of the square root function?
The range of the square root function is also the set of all non-negative real numbers. This is because the square root of a non-negative number is always non-negative. Mathematically, this is expressed as [0, ∞).
3. How do you graph the square root function?
To graph f(x) = √x:
- Identify key points such as (0,0), (1,1), (4,2), and (9,3).
- Plot these points on a coordinate plane.
- Draw a smooth curve starting from the origin and passing through the plotted points, keeping the curve in the first quadrant.
4. What transformations can be applied to the square root function?
Transformations include:
- Vertical Shifts:
f(x) = √x + kshifts the graph up by k units. - Horizontal Shifts:
f(x) = √(x - h)shifts the graph to the right by h units. - Vertical Stretch/Compression:
f(x) = a√xstretches the graph vertically if a > 1 and compresses it if 0 < a < 1. - Horizontal Stretch/Compression:
f(x) = √(bx)compresses the graph horizontally if b > 1 and stretches it if 0 < b < 1.
5. Why can't the square root function produce negative outputs?
The square root function only produces non-negative outputs because the square root of a non-negative number is always non-negative. In other words, for any x ≥ 0, √x is always ≥ 0.
6. What are common mistakes to avoid when working with square root functions?
Common mistakes include:
- Using negative values for x, which are not in the domain of the function.
- Incorrectly applying transformations, such as mixing up vertical and horizontal shifts.
- Forgetting that the range of the function is
[0, ∞)and includes only non-negative values. - Not selecting enough key points when graphing, leading to an inaccurate curve.
7. How do you find the inverse of the square root function?
The inverse of the square root function f(x) = √x is the squaring function f-1(x) = x2. To find the inverse:
- Write the function as
y = √x. - Swap x and y:
x = √y. - Solve for y:
y = x2. - The inverse function is
f-1(x) = x2.
8. Can the square root function be applied to complex numbers?
In the real number system, the square root function is only defined for non-negative numbers. However, in the complex number system, every complex number has a square root. This extends the domain of the square root function to include negative numbers and complex numbers, but this is beyond the scope of basic graphing.
These FAQs address common questions and issues related to the square root function, helping to build a clearer understanding of its properties and applications.
Đồ thị hàm căn bậc hai sử dụng phép biến đổi và đánh dấu điểm.
Đồ thị hàm căn bậc hai - Sử dụng biến đổi và đánh dấu điểm
READ MORE:
Biểu đồ nhanh y = căn bậc hai của x.
Biểu đồ nhanh y = căn bậc hai của x