Topic square root transformation: The square root transformation is a powerful statistical technique used to stabilize variance, normalize distributions, and highlight patterns in data. This article explores its benefits, real-world applications, and implementation in various statistical software, providing a comprehensive guide for data analysts and researchers.
Table of Content
- Square Root Transformation
- Table of Contents
- Introduction to Square Root Transformation
- Benefits of Square Root Transformation
- Applications in Statistical Analysis
- Examples of Square Root Transformation in Real-world Data
- Comparison with Other Data Transformations
- Challenges and Considerations
- Implementing Square Root Transformation in Statistical Software
- Conclusion and Summary of Square Root Transformation
- YOUTUBE:
Square Root Transformation
Square root transformation is a mathematical operation applied to data to make it more normally distributed or to stabilize variance. It is commonly used in statistical analysis and data preprocessing tasks.
In data analysis, square root transformation is particularly useful when dealing with data that exhibits skewed distributions or heteroscedasticity, where the variance of the data is not constant across its range.
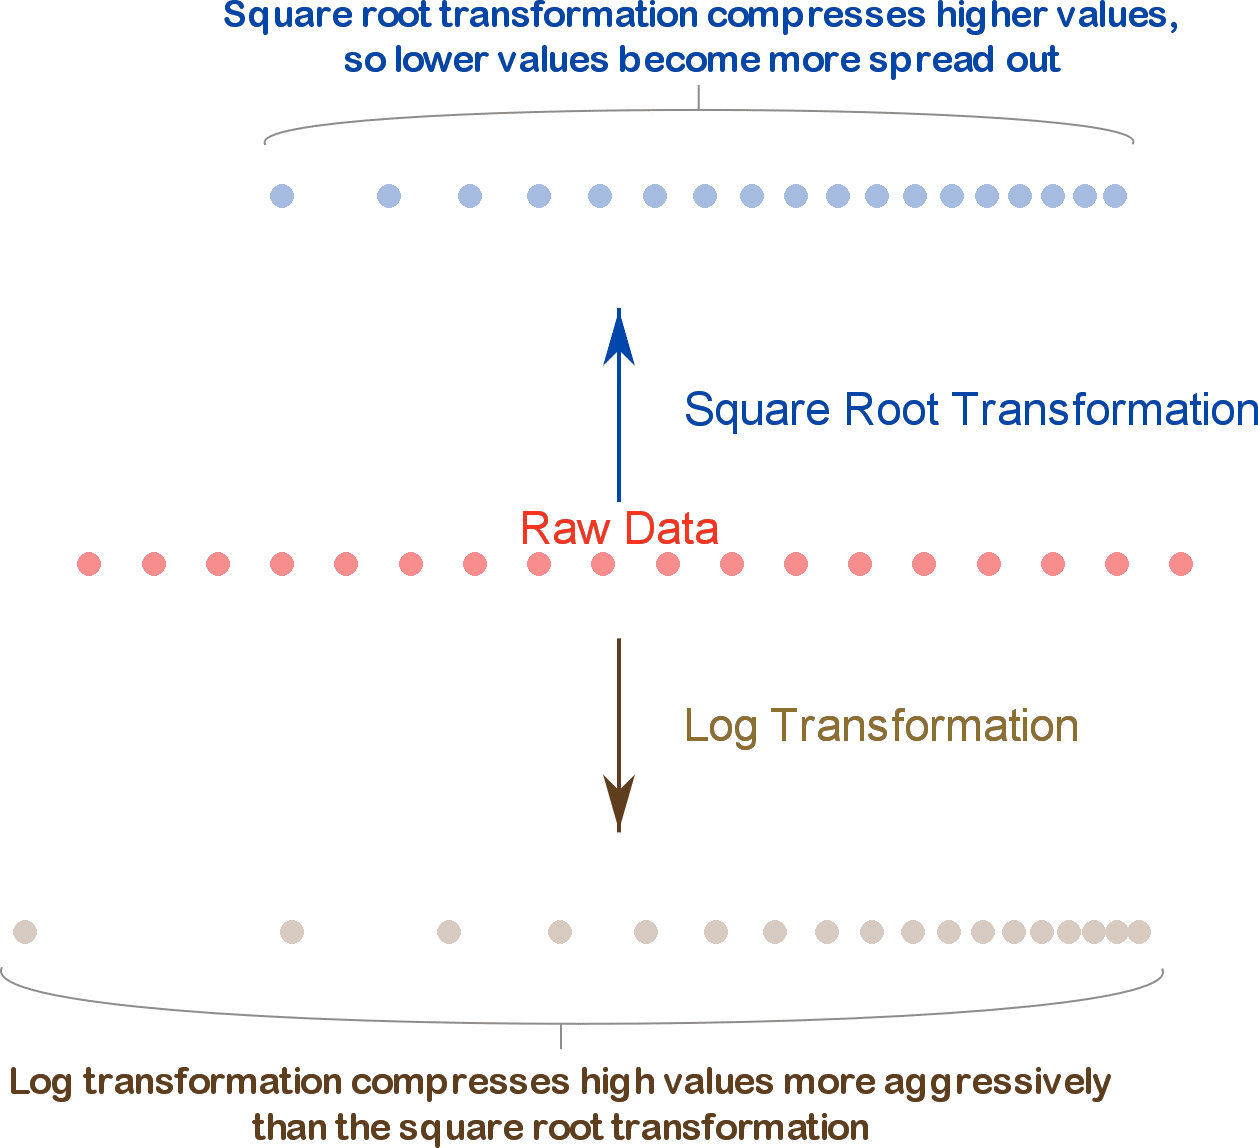
The transformation involves taking the square root of each data point, which has the effect of compressing larger values and expanding smaller values, thereby potentially making the data more symmetrical and improving the performance of statistical models that assume normality.
Square root transformation is widely applied in various fields including finance, economics, biology, and social sciences, where accurate data analysis often requires data to meet certain statistical assumptions.

READ MORE:
Table of Contents
Introduction to Square Root Transformation
The square root transformation is a technique used in statistical analysis to stabilize variance and normalize data distributions. This transformation is particularly useful for data that follows a Poisson distribution or has a right skew.
Benefits of Square Root Transformation
Applying the square root transformation can enhance the interpretability of data, improve the accuracy of statistical models, and reduce heteroscedasticity, leading to more reliable results.
Applications in Statistical Analysis
This transformation is widely used in various fields such as biology, medicine, and social sciences to handle skewed data, stabilize variance, and meet the assumptions of parametric tests.
Examples of Square Root Transformation in Real-world Data
Real-world examples include transforming count data in ecological studies, normalizing financial returns, and adjusting for skewness in survey data. The transformed data often reveals clearer patterns and relationships.
Comparison with Other Data Transformations
Compared to logarithmic and Box-Cox transformations, the square root transformation is simpler to apply and interpret, making it a popular choice for moderate skewness and count data.
Challenges and Considerations
While the square root transformation is useful, it may not be suitable for data with zero or negative values. Additionally, interpreting transformed data can be challenging, and the choice of transformation should be guided by the data's characteristics.
Implementing Square Root Transformation in Statistical Software
Most statistical software, such as R, Python, and SPSS, provide built-in functions to apply the square root transformation. The following examples demonstrate how to perform this transformation in different software:
- R:
sqrt(data) - Python (Pandas):
np.sqrt(data) - SPSS: Use the Compute Variable dialog box to apply the square root function.

Conclusion and Summary of Square Root Transformation
The square root transformation is a valuable tool for data analysts seeking to stabilize variance and normalize data distributions. By understanding its benefits, applications, and implementation, researchers can effectively apply this technique to enhance their statistical analyses.
Introduction to Square Root Transformation
The square root transformation is a powerful tool in data analysis used to stabilize variance, normalize distributions, and make data more suitable for linear modeling. By applying the square root transformation to a variable \( Y \), high values get compressed while low values are spread out, which can address issues such as right-skewness in data distributions.
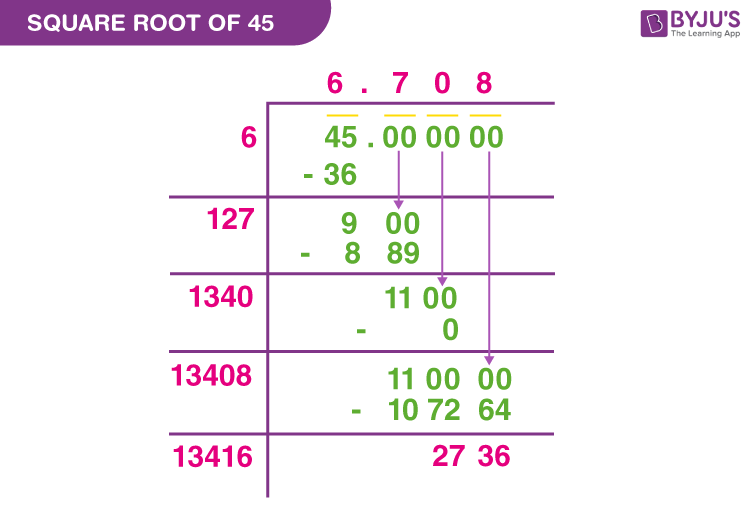
Mathematically, the square root transformation is represented as:
\[ Y' = \sqrt{Y} \]
It's important to note that this transformation is only applicable to non-negative values. When dealing with negative values, alternative transformations like Yeo-Johnson or Box-Cox are more appropriate.
Applications of the square root transformation include:
- Normalizing Skewed Distributions: Useful for right-skewed data to achieve normality, which is crucial for many statistical tests and models.
- Transforming Non-Linear Relationships: Helps in linear regression by transforming non-linear relationships into linear ones.
- Reducing Heteroscedasticity: Stabilizes variance across levels of an independent variable, enhancing model assumptions and performance.
- Improving Data Visualization: Enhances clarity by making high and low values more comparable on plots.
To implement a square root transformation in Python, one can use the following code snippet:
import numpy as np
import pandas as pd

# Example DataFrame
df = pd.DataFrame({'Variable': [1, 4, 9, 16, 25]})

# Applying square root transformation
df['Transformed_Variable'] = np.sqrt(df['Variable'])
print(df)
By understanding and correctly applying the square root transformation, data analysts can significantly improve the quality and interpretability of their data analysis.
Benefits of Square Root Transformation
The square root transformation is a powerful technique used to address various data-related issues in statistical analysis. Here are some key benefits:
- Variance Stabilization: It helps stabilize variance, especially in datasets with count data or where variance increases with the mean. This is crucial for improving the accuracy of statistical models.
- Normality: It aids in normalizing positively skewed data, making it more suitable for parametric tests which assume normality.
- Linearity: The transformation can linearize relationships between variables, making linear models more applicable and reliable.
- Handling Poisson Distributions: For data following a Poisson distribution, the square root transformation can make the data resemble a Gaussian distribution, which is beneficial for certain statistical analyses.
- Improved Interpretation: By transforming data, it becomes easier to interpret the relationships and trends within the dataset, facilitating better decision-making.
Applying the square root transformation can significantly enhance the robustness and interpretability of your statistical models, particularly in dealing with heteroscedasticity and skewness issues.
Applications in Statistical Analysis
The square root transformation is widely used in statistical analysis to stabilize variance, normalize data, and improve the interpretability of results. Here are some common applications:
-
Variance Stabilization:
The square root transformation is particularly effective in stabilizing variance when dealing with count data or data following a Poisson distribution. By applying the transformation, we can make the variance more constant across different levels of the data.
-
Normalization of Data:
In many statistical analyses, the assumption of normality is crucial. The square root transformation can help in normalizing skewed data, making it more suitable for parametric tests that assume a normal distribution.
-
Improving Homoscedasticity:
Homoscedasticity, or constant variance of residuals, is an important assumption in regression analysis. The square root transformation can help achieve this by reducing heteroscedasticity, thus leading to more reliable regression models.
-
Enhancing Interpretability:
In certain cases, the square root transformation can simplify the interpretation of data by reducing the range of values and highlighting meaningful patterns or trends that were less apparent in the original scale.
Here are some specific examples of how the square root transformation is applied in statistical analysis:
-
Poisson Regression:
In Poisson regression models, the square root transformation can be used to stabilize the variance of the response variable. This helps in meeting the assumptions of the regression model and improves the accuracy of predictions.
-
ANOVA (Analysis of Variance):
When conducting ANOVA, transforming the data using the square root can help in meeting the assumption of equal variances among groups. This makes the test results more robust and reliable.
-
Ecological and Environmental Studies:
In ecological research, data such as species counts often follow a Poisson distribution. Applying the square root transformation can normalize these counts, making it easier to analyze relationships and patterns within the data.
-
Quality Control:
In quality control processes, the square root transformation can be used to stabilize the variance of defect counts or other quality metrics, leading to more consistent and interpretable control charts.
Overall, the square root transformation is a versatile tool in statistical analysis, providing benefits such as variance stabilization, data normalization, improved homoscedasticity, and enhanced interpretability. By carefully applying this transformation, analysts can derive more accurate and meaningful insights from their data.

Examples of Square Root Transformation in Real-world Data
Square root transformations are commonly applied in various fields to address issues of skewness and variance stabilization in data. Here are some notable examples:
1. Environmental Data
In environmental studies, square root transformations are often used to normalize data distributions and stabilize variances. For instance, when analyzing turbidity levels in water bodies, the square root transformation helps in making the data more normally distributed, facilitating better interpretation and statistical analysis.
T_sqrt = sqrt(Turbidity)This transformation can be visualized using histograms before and after applying the square root transformation to observe the changes in distribution.
2. Population and Land Area Analysis
Consider the dataset of the population and land area of the 50 US states. The raw population data may exhibit a right-skewed distribution, making it challenging to perform statistical analyses that assume normality. Applying a square root transformation can moderate this skewness.
- Original Population Histogram: Right-skewed distribution.
- Square Root Transformed Histogram: Distribution closer to normal.
Similarly, scatter plots of population versus land area can become clearer after transformation, making it easier to identify patterns and relationships.
3. Count Data in Statistical Models
Square root transformations are frequently recommended for count data in statistical models, such as Poisson regression models, to stabilize the variance and make the data more suitable for analysis.
Y_sqrt = sqrt(CountData)This technique is particularly useful in biological and medical research, where count data (e.g., number of occurrences of a particular event) are common.
4. Medical Research
In clinical trials and medical research, square root transformations are applied to data such as the number of cells, bacteria counts, or incidence rates of a disease to meet the assumptions of parametric statistical tests and improve the robustness of the results.
- Example: Transforming bacterial counts to stabilize variances across different treatment groups.
5. Economics and Social Sciences
Economic data, such as income or expenditure, often require transformation due to skewness. Applying a square root transformation can help in achieving a more symmetrical distribution, facilitating more accurate statistical analyses.
Income_sqrt = sqrt(Income)Researchers use this transformation to ensure that their econometric models meet the assumptions required for valid inferences.
These examples demonstrate the versatility and effectiveness of square root transformations in making diverse types of data more amenable to analysis, thus providing clearer insights and more reliable statistical results.
Comparison with Other Data Transformations
Data transformations are commonly used in statistical analysis to normalize data, stabilize variance, and make the data more suitable for modeling. The square root transformation is one of several transformation techniques, each with its own strengths and appropriate use cases. Below, we compare the square root transformation with other popular data transformations.
Square Root Transformation
The square root transformation is primarily used to reduce right skewness in data. It is effective for count data and other data types where values are positive and can benefit from mild compression of larger values.
- Mathematical Form: \( y' = \sqrt{y} \)
- Use Case: Ideal for count data and positive values to reduce right skewness.
- Limitation: Not suitable for data with negative or zero values.
Logarithmic Transformation
The logarithmic transformation is another common technique used to handle right-skewed data, often more aggressively than the square root transformation.
- Mathematical Form: \( y' = \log(y) \)
- Use Case: Useful for data with a wide range and high positive skewness.
- Limitation: Cannot be applied to zero or negative values without modification (e.g., \( \log(y+1) \)).
Cube Root Transformation
The cube root transformation is less commonly used but can be effective for both positive and negative values.
- Mathematical Form: \( y' = y^{1/3} \)
- Use Case: Applicable to both positive and negative values, less aggressive than logarithmic transformation.
- Limitation: May not be as effective in reducing skewness as the log transformation.
Box-Cox Transformation
The Box-Cox transformation is a family of power transformations that include the square root and log transformations as special cases. It is more flexible and can be tuned to achieve normality.
- Mathematical Form: \( y' = \frac{y^\lambda - 1}{\lambda} \) for \( \lambda \neq 0 \); \( y' = \log(y) \) for \( \lambda = 0 \)
- Use Case: Can be optimized for normality across a range of data distributions.
- Limitation: Requires estimation of the parameter \( \lambda \), which can be complex.
Comparison Table
| Transformation | Formula | Use Cases | Limitations |
|---|---|---|---|
| Square Root | \( y' = \sqrt{y} \) | Count data, positive values | Not for negative or zero values |
| Logarithmic | \( y' = \log(y) \) | High skewness, wide range | Not for zero or negative values without modification |
| Cube Root | \( y' = y^{1/3} \) | Positive and negative values | Less effective for high skewness |
| Box-Cox | \( y' = \frac{y^\lambda - 1}{\lambda} \) | Flexible, normality optimization | Complex parameter estimation |
In summary, while the square root transformation is useful for certain types of data, other transformations like logarithmic, cube root, and Box-Cox provide different levels of flexibility and effectiveness depending on the nature of the data and the specific requirements of the analysis.
Challenges and Considerations
The square root transformation is a valuable tool in statistical analysis, but it comes with several challenges and considerations. Below are some key points to keep in mind:
-
Handling Negative Values:
The square root transformation cannot be applied directly to negative values, as the square root of a negative number is undefined in the realm of real numbers. This can lead to missing values in the transformed data, which may not be missing at random and can bias the analysis. A possible workaround is to add a constant to the data to make all values positive before transformation, though this must be done with caution to avoid distorting the data.
-
Impact on Data Interpretation:
While the square root transformation can help stabilize variance and normalize distributions, it also changes the scale of the data, which can affect the interpretability of the results. For instance, in regression analysis, the coefficients obtained after transformation may not have the same straightforward interpretation as they would on the original scale.
-
Non-Uniform Effect:
The transformation has a non-uniform effect on the data, compressing high values and spreading out low values. This can be beneficial for reducing right skewness but may not be suitable for left-skewed data. In cases of left skewness, other transformations like log or cube root may be more appropriate.
-
Applicability to Different Data Types:
The square root transformation is particularly useful for count data and other types of data that follow a Poisson distribution. However, its effectiveness varies depending on the nature of the data and the specific statistical techniques being used. For example, it may not be the best choice for data with a high proportion of zeroes or for data that does not follow a Poisson-like distribution.
-
Alternative Transformations:
Other transformations, such as log, Box-Cox, and Yeo-Johnson, offer different advantages and can sometimes be more effective at achieving normality and homoscedasticity. The choice of transformation should be guided by the data characteristics and the specific goals of the analysis.
In summary, while the square root transformation is a powerful tool, careful consideration must be given to the nature of the data, the potential for introducing bias, and the impact on the interpretability of results. Evaluating alternative transformations and understanding their implications is crucial for effective data analysis.
Implementing Square Root Transformation in Statistical Software
Square root transformation can be effectively implemented in various statistical software packages to handle non-normal data distributions and reduce skewness. Below are step-by-step guides for implementing square root transformation in popular statistical software tools.
Python
- Import necessary libraries:
import pandas as pd import numpy as np - Load your dataset into a DataFrame:
df = pd.read_csv('your_dataset.csv') - Apply the square root transformation to a specific column:
df['transformed_column'] = np.sqrt(df['original_column']) - View the transformed data:
print(df[['original_column', 'transformed_column']].head())
R
- Load necessary library and data:
data <- read.csv('your_dataset.csv') - Apply the square root transformation:
data$transformed_column <- sqrt(data$original_column) - View the transformed data:
head(data[, c('original_column', 'transformed_column')])
Excel
- Open your dataset in Excel.
- Insert a new column next to the column you want to transform.
- Use the SQRT function to transform the data:
=SQRT(A2)Drag this formula down to apply it to all rows.
SAS
- Import your data:
data mydata; infile 'your_dataset.csv' dlm=',' firstobs=2; input var1 var2 var3; run; - Create a new variable with the square root transformation:
data mydata; set mydata; transformed_var = sqrt(original_var); run; - Print the transformed data:
proc print data=mydata;
    var original_var transformed_var;
run;
SPSS
- Open your dataset in SPSS.
- Select Transform > Compute Variable.
- In the "Target Variable" field, enter the name for the new variable.
- In the "Numeric Expression" field, enter:
sqrt(original_variable) - Click OK to create the transformed variable.
Implementing square root transformation in these statistical software packages can help manage skewness and improve the normality of data distributions, facilitating more robust statistical analysis.
Conclusion and Summary of Square Root Transformation
The square root transformation is a valuable tool in statistical analysis, providing several key benefits and applications. This technique is especially useful when dealing with data that exhibits heteroscedasticity or non-normal distribution. By applying the square root transformation, analysts can achieve more stable variance and a distribution that is closer to normal, which in turn facilitates more accurate statistical inferences.
Key points to consider include:
- Reducing Skewness: The square root transformation helps to reduce positive skewness in data, making it more symmetrical and easier to analyze using standard statistical methods.
- Stabilizing Variance: This transformation stabilizes the variance of the data, which is crucial for fulfilling the assumptions of various statistical tests, particularly those requiring homoscedasticity.
- Improving Normality: By transforming the data, the distribution of the dataset approaches normality, enabling the use of parametric tests that assume a normal distribution.
- Enhancing Interpretability: Transformed data can be easier to interpret and visualize, providing clearer insights and more straightforward communication of results.
However, it is essential to recognize that the square root transformation is not universally applicable. It is most effective for count data or data with a range that includes only positive values. Analysts should carefully consider the nature of their data and the goals of their analysis before applying this transformation.
In practice, implementing the square root transformation in statistical software is straightforward. Most statistical packages offer built-in functions to perform this transformation, allowing users to quickly and efficiently apply it to their datasets. Here is a basic step-by-step outline for implementing the square root transformation:
- Identify the appropriate data: Ensure that the data is suitable for square root transformation, typically positive values or counts.
- Apply the transformation: Use the square root function available in your statistical software to transform the data. For example, in Python, you can use
numpy.sqrt(). - Verify the results: Check the transformed data to ensure that the skewness and variance have been appropriately adjusted.
- Conduct further analysis: Use the transformed data in subsequent statistical analyses, ensuring that the assumptions of the tests being used are met.
In conclusion, the square root transformation is a potent method for improving the quality of statistical analyses by addressing issues related to skewness, variance, and normality. When used appropriately, it can enhance the robustness and reliability of the results, making it an essential tool in the arsenal of data analysts and statisticians.
Đồ Thị Hóa Các Hàm Số Căn Bậc Hai Bằng Cách Sử Dụng Biến Đổi & Vẽ Điểm
READ MORE:
Đồ Thị Hóa Hàm Số Căn Bậc Hai Bằng Cách Sử Dụng Biến Đổi