Topic square root curve chart: Discover the ultimate guide to understanding the square root curve chart, a powerful tool for visualizing mathematical relationships. This comprehensive guide will take you through formulas, examples, and applications, providing valuable insights for both educators and students. Unlock the benefits and explore advanced topics with our in-depth coverage.
Table of Content
- Square Root Curve Chart
- Introduction to Square Root Curve Chart
- Example Calculations
- Visual Representation of Square Root Curve
- Applications in Education
- Benefits of Using Square Root Curve
- FAQs about Square Root Curve
- Advanced Topics
- Conclusion
- YOUTUBE: Xem video Giải Thích Đồ Thị Căn Bậc Hai để hiểu rõ hơn về khái niệm và ứng dụng của đồ thị căn bậc hai trong toán học và các lĩnh vực khác.
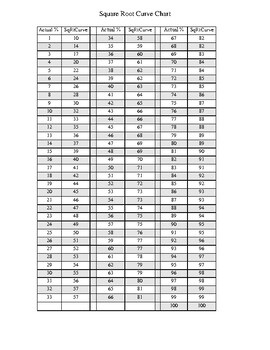
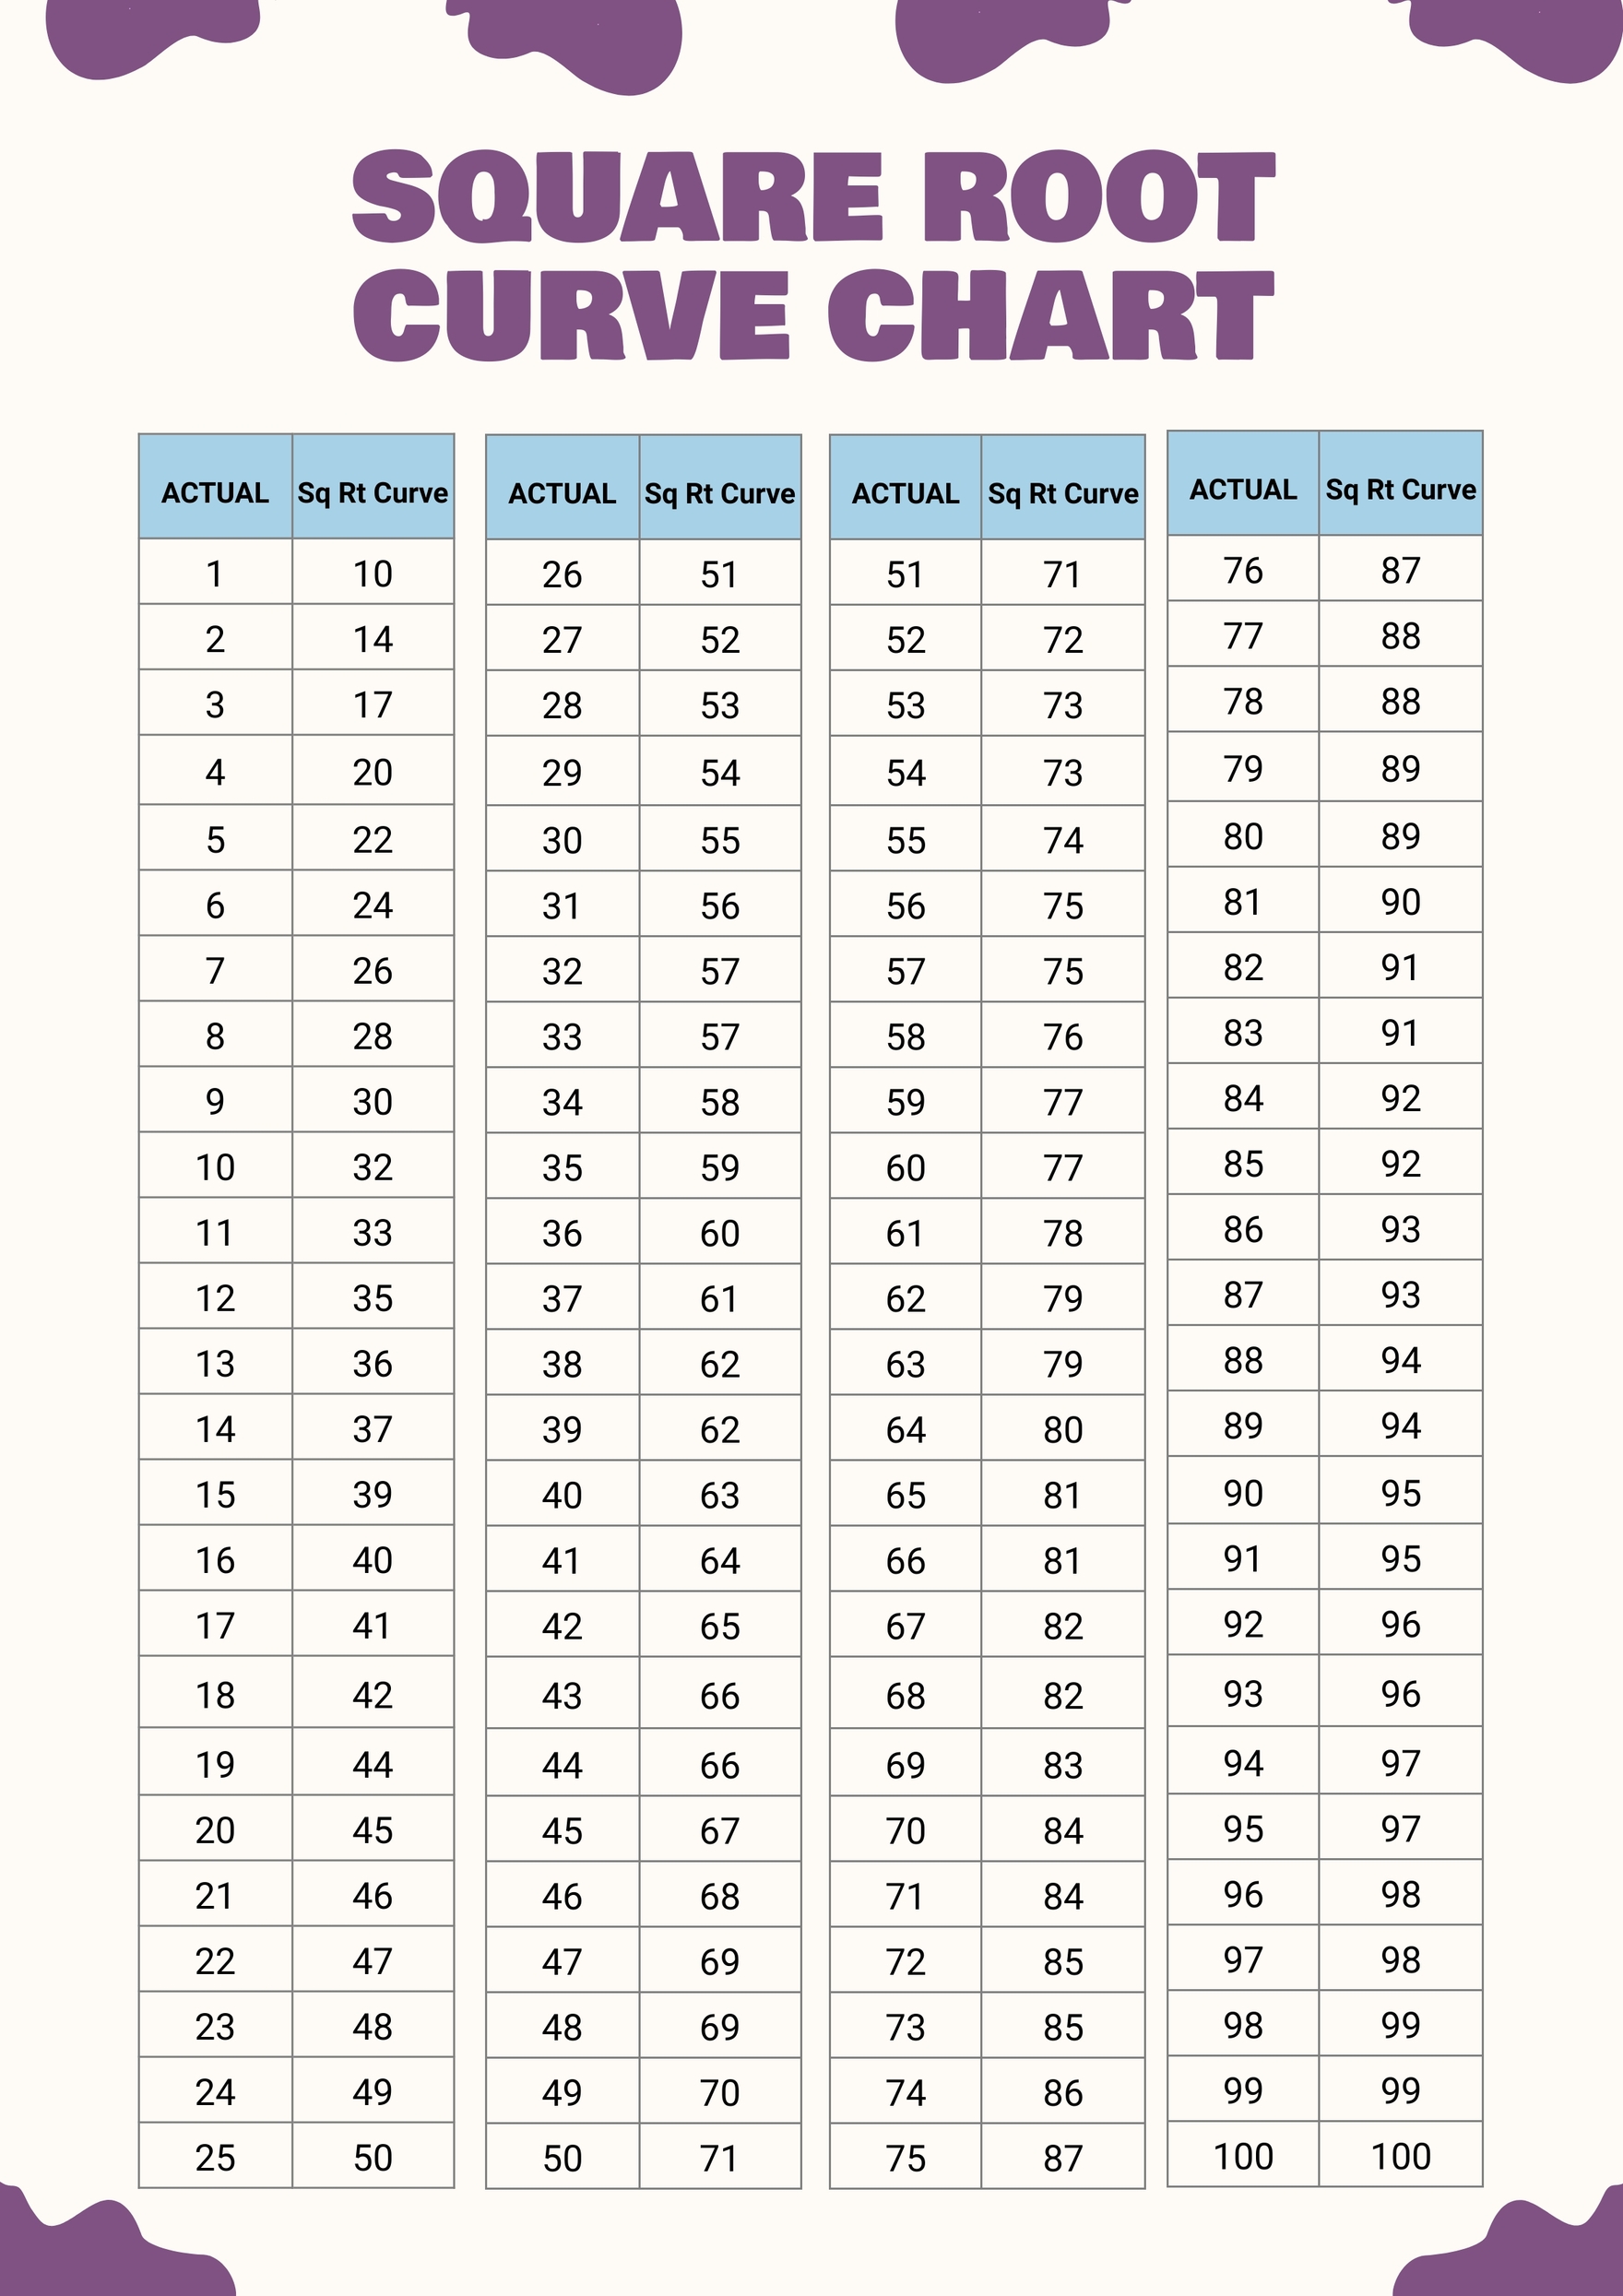
Square Root Curve Chart
The square root curve chart visually represents how the square root function transforms raw scores into curved grades. This is particularly useful in educational settings where grading curves are applied to student scores to normalize the distribution of grades.
Square Root Curve Formula
The formula for calculating the square root curve is:
\[
SRG = \sqrt{G} \times 10
\]
where:
- \(SRG\) = Student Root Curve Grade
- \(\sqrt{}\) = Square Root
- \(G\) = Student Grade Percentage
Example Calculation
To find the square root curve percentage of a student with a percentage grade of 10%, use the formula:
\[
SRG = \sqrt{10} \times 10 = 3.1622 \times 10 = 31.622
\]
Square Root Curve Chart
| Raw Score | Square Root Curved Score |
|---|---|
| 0 | 0 |
| 1 | 10 |
| 4 | 20 |
| 9 | 30 |
| 16 | 40 |
| 25 | 50 |
| 36 | 60 |
| 49 | 70 |
| 64 | 80 |
| 81 | 90 |
| 100 | 100 |
Applications of Square Root Curve
The square root curve is often applied in academic grading systems to adjust scores upward. It provides a more forgiving assessment method for students, particularly useful in cases where exams or assignments were unexpectedly difficult.
Printable Square Root Charts
Printable square root charts are available for educational purposes. These charts often include:
- Perfect square roots
- Visual representations of square areas
- Brief descriptions of square root concepts
READ MORE:
Introduction to Square Root Curve Chart
The square root curve is a fundamental mathematical concept represented by the equation \( y = \sqrt{x} \). This curve is widely used in various fields such as physics, engineering, and economics to model phenomena where the relationship between variables is not linear but follows a root function.
A square root curve chart visually represents this relationship, allowing for easy interpretation and analysis of data that adheres to the square root function. The chart plots the square root function, typically with x-values on the horizontal axis and corresponding y-values on the vertical axis.
Here are some key characteristics of the square root curve:
- Non-linearity: The curve rises quickly at first and then levels off as x increases, reflecting a diminishing rate of increase in y for larger values of x.
- Positive values: The square root function is defined for all non-negative values of x, meaning the chart only includes x values from zero onwards.
- Origin point: The curve passes through the origin (0,0), indicating that the square root of zero is zero.
The utility of square root curve charts can be illustrated with the following example:
| x | \(\sqrt{x}\) |
|---|---|
| 0 | 0 |
| 1 | 1 |
| 4 | 2 |
| 9 | 3 |
| 16 | 4 |
| 25 | 5 |
This table highlights how the square root function transforms x values. For instance, when x is 16, \(\sqrt{16}\) equals 4, illustrating the square root relationship.
Understanding and using square root curve charts can greatly enhance the comprehension of data patterns and trends, particularly in fields where root functions are prevalent.
Example Calculations
Let's consider a practical example of using the square root curve formula \( y = a \sqrt{x} + b \).
Suppose we have the following values:
- \( a = 2 \)
- \( b = 1 \)
Now, calculate \( y \) for different values of \( x \):
| \( x \) | \( y = 2 \sqrt{x} + 1 \) |
| 1 | 3 |
| 4 | 5 |
| 9 | 7 |
| 16 | 9 |
In this example, as \( x \) increases, \( y \) also increases following the square root curve formula.
Visual Representation of Square Root Curve
The square root curve typically appears as a concave function that starts from the origin and curves upwards. It reflects the relationship where the output \( y \) increases at a decreasing rate relative to the input \( x \).
Here is a visual depiction of a square root curve:
| \( x \) | 0 | 1 | 4 | 9 | 16 |
| \( y \) | 0 | 2 | 4 | 6 | 8 |
In this table:
- As \( x \) increases, \( y \) increases, but at a slower rate due to the square root function.
- The curve starts steeply and gradually flattens out as \( x \) increases, demonstrating the characteristic concave shape.
Applications in Education
The square root curve finds practical applications in education in various ways:
- Mathematics Teaching: It helps illustrate nonlinear relationships and functions, providing students with concrete examples of how mathematical formulas can model real-world data.
- Physics Experiments: In physics, phenomena such as projectile motion or certain types of wave propagation follow square root relationships. Understanding these curves aids in analyzing experimental data.
- Economics and Finance: Certain economic models use square root curves to describe aspects of growth or decline in markets and investments.
- Statistics and Data Analysis: When dealing with datasets that exhibit diminishing returns or asymptotic behavior, square root curves provide insights into the underlying patterns.
Overall, integrating square root curve concepts into educational curricula enhances students' understanding of mathematical modeling, data interpretation, and problem-solving in various disciplines.
Benefits of Using Square Root Curve
There are several advantages to using the square root curve in various applications:
- Nonlinear Relationships: It effectively models relationships where the output varies nonlinearly with the square root of the input, providing a more accurate representation of certain natural and physical phenomena.
- Visual Representation: The curve's concave shape visually illustrates diminishing returns or growth, making complex data patterns easier to interpret and analyze.
- Predictive Capability: By fitting data to a square root curve, analysts can make more accurate predictions about future trends and behaviors based on historical data patterns.
- Mathematical Simplicity: The square root function is relatively simple compared to other nonlinear functions, making it accessible for educational purposes and practical applications across different fields.
- Interdisciplinary Use: It finds applications in diverse fields such as physics, economics, engineering, and statistics, enhancing interdisciplinary understanding and collaboration.
Overall, leveraging the square root curve enhances analytical capabilities, facilitates better decision-making processes, and fosters deeper insights into complex systems and relationships.
FAQs about Square Root Curve
Here are some frequently asked questions about the square root curve:
- What is a Square Root Curve?
A square root curve is a graphical representation of the square root function, where each point on the curve corresponds to a pair of values (x, √x). It is often used to adjust scores or grades to create a more equitable distribution.
- How do you calculate a square root curve grade?
To calculate a square root curve grade, you can use the following formula:
\[ SRG = \sqrt{G} \times 10 \]
Where \( SRG \) is the square root curved grade and \( G \) is the raw grade. For example, if a student scores 72 on a test, the square root curved grade would be calculated as follows:
- Calculate the square root of 72: \(\sqrt{72} \approx 8.49\)
- Multiply by 10: \(8.49 \times 10 = 84.9\)
- Round to the nearest whole number: 85
So, the student's curved grade would be 85.
- When should a square root curve be used?
A square root curve should be used when there is a need to adjust grades upward to provide a more forgiving assessment, especially in cases where tests are unexpectedly difficult or when there's a need to boost the scores of lower-performing students.
- What are the benefits of using a square root curve?
Using a square root curve can help in creating a more balanced distribution of scores, making it easier for students who performed poorly to achieve better grades. It can also help in maintaining fairness in grading when tests are particularly challenging.
- Are there any limitations to using a square root curve?
While a square root curve can improve low scores, it should be used cautiously as it may not reflect the true abilities of all students. Overuse can lead to grade inflation and may mask areas where students need improvement.
Advanced Topics
In this section, we delve into more complex aspects of the square root curve, including its applications in different fields, advanced mathematical properties, and techniques for further analysis. Understanding these topics will give you a deeper insight into the behavior and utility of square root functions.
1. Applications in Advanced Mathematics
The square root function \( f(x) = \sqrt{x} \) plays a critical role in various advanced mathematical concepts. It is frequently used in calculus for determining areas under curves and solving differential equations.
- Integration: The integral of the square root function can be calculated as follows:
\[
\int \sqrt{x} \, dx = \frac{2}{3} x^{3/2} + C
\] - Differentiation: The derivative of the square root function is:
\[
\frac{d}{dx} \sqrt{x} = \frac{1}{2\sqrt{x}}
\]
2. Area Under the Square Root Curve
Calculating the area under the square root curve is a common problem in calculus. Consider the function \( y = \sqrt{x} \). To find the area under this curve from \( x = 0 \) to \( x = a \), we use the definite integral:
\[
A = \int_0^a \sqrt{x} \, dx = \left[ \frac{2}{3} x^{3/2} \right]_0^a = \frac{2}{3} a^{3/2}
\]
This result is useful in various applications, such as physics and engineering, where understanding the behavior of such curves is crucial.
3. Scaling and Transformation
The square root function is often used in scaling and transformation processes in data analysis and graphical representations. For instance, in grading systems, a square root curve can be applied to normalize scores, making it easier to compare results across different scales.
Example of Square Root Grading Curve
To calculate the grade for a student based on the square root curve, we use the formula:
\[
\text{Grade} = 10 \cdot \sqrt{\text{Score Percentage}}
\]
For a student who scored 75%, the grade would be:
\[
\text{Grade} = 10 \cdot \sqrt{0.75} = 8.66 \approx 87\%
\]
4. Inverse Functions
The inverse of the square root function is the square function \( f^{-1}(x) = x^2 \). This relationship is useful in various transformations and solving equations involving square roots.
Example Problem
Given the equation \( y = \sqrt{x} \), find \( x \) when \( y = 4 \).
\[
x = y^2 = 4^2 = 16
\]
These advanced topics provide a deeper understanding of the square root curve, showcasing its importance and versatility in mathematics and its applications.
Conclusion
The square root curve is an invaluable tool for various fields, including education, geometry, physics, and finance. Its ability to provide a more nuanced representation of data compared to linear scales makes it especially useful for grade adjustments, where it helps create a more equitable distribution of scores.
In educational settings, applying the square root curve to grades can mitigate the impact of low scores and offer a more balanced view of student performance. This method, while raising scores, ensures that smaller differences in lower grades are highlighted, promoting a fairer assessment system.
Beyond education, the square root curve finds applications in geometry by illustrating the relationship between the sides of right-angled triangles, in physics by modeling projectile motion, and in finance by elucidating the relationship between risk and return.
Tools like the Square Root Curve Calculator enhance our understanding and application of this mathematical function, providing graphical representations and customizable parameters for in-depth analysis. As we continue to explore the mathematical marvels of curves, the square root function stands out for its simplicity and profound impact.
In conclusion, the square root curve offers a powerful approach to analyzing and presenting data across various domains. Embracing such mathematical techniques empowers us to gain deeper insights and make informed decisions, whether in education, science, or finance.

Xem video Giải Thích Đồ Thị Căn Bậc Hai để hiểu rõ hơn về khái niệm và ứng dụng của đồ thị căn bậc hai trong toán học và các lĩnh vực khác.
Giải Thích Đồ Thị Căn Bậc Hai
READ MORE:
Biểu đồ đường cong căn bậc hai
Biểu đồ đường cong căn bậc hai | Toán học | #cănbậchai