Topic chi square 2x2: Welcome to our comprehensive guide on the Chi Square 2x2 test. This article will help you understand the fundamental concepts, calculations, and applications of the Chi Square test in analyzing 2x2 contingency tables. Dive in to master this essential statistical tool and enhance your data analysis skills.
Table of Content
- Chi-Square 2x2 Analysis
- Introduction to Chi Square Test
- Understanding Contingency Tables
- 2x2 Table: Test of 2 Independent Proportions
- Chi Square Calculation and Interpretation
- Chi Square with Yates' Correction
- Examples of Chi Square Test
- Assumptions of Chi Square Test
- Using Chi Square Calculator
- Chi Square vs. Other Statistical Tests
- Common Mistakes in Chi Square Analysis
- Advanced Topics in Chi Square Testing
- Graphing Chi Square Results
- YOUTUBE:
Chi-Square 2x2 Analysis
The chi-square test is a statistical method used to determine if there is a significant association between two categorical variables. This is commonly performed using a 2x2 contingency table.
Contingency Table
A 2x2 contingency table is structured as follows:
| Group 1 | Group 2 | |
| Outcome 1 | a | b |
| Outcome 2 | c | d |
Chi-Square Test Formula
The chi-square statistic (\(\chi^2\)) is calculated using the formula:
$$\chi^2 = \sum \frac{(O_i - E_i)^2}{E_i}$$
where \(O_i\) represents the observed frequency and \(E_i\) represents the expected frequency in each category.
Calculating Expected Frequencies
The expected frequency for each cell in a 2x2 table is calculated as follows:
$$E_{ij} = \frac{(Row \, Total \, * \, Column \, Total)}{Grand \, Total}$$
Steps to Perform Chi-Square Test
- Set up your 2x2 contingency table with observed frequencies.
- Calculate the expected frequencies for each cell.
- Compute the chi-square statistic using the formula provided.
- Compare the calculated chi-square value to the critical value from the chi-square distribution table to determine statistical significance.
Assumptions
- The sample data should be randomly selected.
- Each observation should be independent of the others.
- Expected frequency in each cell should be at least 5.
Interpreting Results
If the chi-square statistic is greater than the critical value, we reject the null hypothesis, indicating a significant association between the variables. Otherwise, we fail to reject the null hypothesis, suggesting no significant association.
Example
Suppose we have the following data in a 2x2 table:
| Smokers | Non-Smokers | |
| Developed Disease | 50 | 30 |
| Did Not Develop Disease | 20 | 100 |
The chi-square statistic would be calculated based on these observed values and their expected frequencies. By comparing the resulting chi-square value to a critical value from the chi-square distribution table, we can determine if there is a significant association between smoking and disease development.
Chi-square tests are a fundamental tool in categorical data analysis, helping to reveal potential associations between variables in a variety of research contexts.
READ MORE:
Introduction to Chi Square Test
The Chi Square test is a statistical method used to examine the differences between categorical variables in a contingency table. It helps determine whether there is a significant association between the variables. This nonparametric test is widely used in research to test hypotheses about the distribution of categorical data.
In a 2x2 contingency table, subjects are categorized based on two factors, each with two levels. For instance, one might compare the presence or absence of a disease (e.g., lung cancer) among smokers and non-smokers. The table helps illustrate the observed and expected frequencies of each category combination.
The formula for the Chi Square test statistic (Χ2) is:
Where O represents the observed frequency and E represents the expected frequency. The summation (Σ) involves calculating this for all categories.
The steps to perform a Chi Square test include:
- Formulate the null hypothesis (H0) that the variables are independent.
- Construct a contingency table with observed frequencies.
- Calculate expected frequencies for each cell based on the marginal totals.
- Apply the Chi Square formula to compute the test statistic.
- Compare the test statistic to the critical value from the Chi Square distribution table.
- If the test statistic exceeds the critical value, reject the null hypothesis, indicating a significant association between the variables.
The Chi Square test is a powerful tool for analyzing categorical data, making it essential for researchers in various fields.
Understanding Contingency Tables
A contingency table, also known as a cross-tabulation or crosstab, is a type of table used in statistics to show the frequency distribution of variables. A 2x2 contingency table is specifically used to analyze the relationship between two categorical variables, each with two possible outcomes.
For example, consider a study on the relationship between smoking (yes/no) and lung cancer (yes/no). The data can be arranged in a 2x2 table as follows:
| Lung Cancer | No Lung Cancer | |
|---|---|---|
| Smokers | a | b |
| Non-Smokers | c | d |
Here, 'a' represents the number of smokers with lung cancer, 'b' the number of smokers without lung cancer, 'c' the number of non-smokers with lung cancer, and 'd' the number of non-smokers without lung cancer.
Interpreting a 2x2 Contingency Table
- Row Totals: Sum the counts horizontally. For example, the total number of smokers is \( a + b \), and the total number of non-smokers is \( c + d \).
- Column Totals: Sum the counts vertically. For example, the total number of people with lung cancer is \( a + c \), and the total number of people without lung cancer is \( b + d \).
- Grand Total: Sum of all counts in the table, \( a + b + c + d \).
Contingency tables help in calculating various probabilities and statistical measures:
- Joint Probability: Probability of events occurring together, e.g., probability of being a smoker and having lung cancer is \( P(\text{smoker} \cap \text{lung cancer}) = \frac{a}{a+b+c+d} \).
- Marginal Probability: Probability of occurrence of a single event, e.g., probability of being a smoker is \( P(\text{smoker}) = \frac{a+b}{a+b+c+d} \).
- Conditional Probability: Probability of one event given another, e.g., probability of having lung cancer given that one is a smoker is \( P(\text{lung cancer}|\text{smoker}) = \frac{a}{a+b} \).
The chi-square test of independence can be used to determine if there is a significant association between the two categorical variables. The test compares the observed frequencies with the expected frequencies, which are calculated under the assumption that the variables are independent.
To perform the chi-square test:
- Calculate the expected frequencies for each cell: \( E = \frac{(\text{row total} \times \text{column total})}{\text{grand total}} \).
- Compute the chi-square statistic: \( \chi^2 = \sum \frac{(O - E)^2}{E} \), where \( O \) is the observed frequency and \( E \) is the expected frequency.
- Compare the chi-square statistic to the critical value from the chi-square distribution table with the appropriate degrees of freedom to determine significance.
Understanding contingency tables is fundamental for performing and interpreting various statistical tests and analyses involving categorical data.
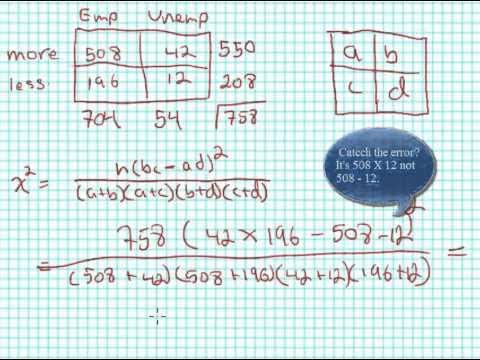
2x2 Table: Test of 2 Independent Proportions
The 2x2 table is a powerful tool used to test the relationship between two categorical variables. In a test of two independent proportions, we analyze the data to determine if there is a significant difference between the proportions of two groups.
Consider a scenario where we want to test if the proportion of success differs between two independent groups. Here is a step-by-step process:
- Construct a 2x2 contingency table:
Group Success Failure Total Group 1 A B A+B Group 2 C D C+D Total A+C B+D A+B+C+D - Calculate the proportions of success in each group:
- \(\hat{p}_1 = \frac{A}{A+B}\) for Group 1
- \(\hat{p}_2 = \frac{C}{C+D}\) for Group 2
- Formulate the null hypothesis \(H_0\) that the proportions are equal:
- \(H_0: p_1 = p_2\)
- \(H_a: p_1 \ne p_2\)
- Calculate the test statistic for the Chi-square test of independence:
- \(\chi^2 = \sum \frac{(O - E)^2}{E}\)
- Determine the expected frequencies under the null hypothesis:
- Expected \(E = \frac{(Row\ Total) \times (Column\ Total)}{Grand\ Total}\)
- Compare the Chi-square statistic to the critical value from the Chi-square distribution table. If the calculated value exceeds the critical value, reject the null hypothesis.
This process allows us to determine if there is a significant association between the two groups based on their proportions of success and failure. The Chi-square test of independence is essential for understanding relationships in categorical data, especially when working with 2x2 contingency tables.
Chi Square Calculation and Interpretation
The Chi-Square test is a statistical method used to determine if there is a significant association between two categorical variables. Here's how you can calculate and interpret the Chi-Square statistic:
- Set up your hypotheses:
- Null hypothesis (\(H_0\)): Assumes no association between the variables.
- Alternative hypothesis (\(H_a\)): Assumes an association between the variables.
- Create a contingency table: Organize your data into a 2x2 table:
Group 1 Group 2 Total Category A A B A + B Category B C D C + D Total A + C B + D N - Calculate expected frequencies: The expected frequency for each cell is calculated using: \[ E = \frac{\text{(row total)} \times \text{(column total)}}{\text{grand total}} \]
- Compute the Chi-Square statistic: Use the formula: \[ \chi^2 = \sum \frac{(O - E)^2}{E} \] where \(O\) represents the observed frequency and \(E\) the expected frequency.
- Determine the degrees of freedom (df): \[ \text{df} = (\text{number of rows} - 1) \times (\text{number of columns} - 1) \] For a 2x2 table, df = 1.
- Compare the Chi-Square statistic to the critical value: Use a Chi-Square distribution table or software to find the critical value at your chosen significance level (e.g., 0.05). If \(\chi^2\) is greater than the critical value, reject \(H_0\).
- Interpret the results: If you reject \(H_0\), conclude that there is a significant association between the variables. If you fail to reject \(H_0\), conclude that there is no significant association.

Chi Square with Yates' Correction
Yates' continuity correction is used to adjust the Pearson Chi-Square test when dealing with a 2x2 contingency table. It makes the test more conservative by correcting for the upward bias that can occur with small sample sizes. This correction is particularly important when expected frequencies in any cell of the table are less than 5.
The corrected formula for the Chi-Square statistic with Yates' correction is:
\[
X^2 = \sum \frac{(|O_i - E_i| - 0.5)^2}{E_i}
\]
where:
- \(O_i\) = observed frequency
- \(E_i\) = expected frequency
- \(|O_i - E_i| - 0.5\) is the adjustment factor to correct for continuity.
To apply Yates' correction, follow these steps:
- Calculate the observed frequencies for each cell of the 2x2 table.
- Determine the expected frequencies for each cell using the formula \( E_i = \frac{(row \ total \times column \ total)}{grand \ total} \).
- Apply the Yates' correction formula to each cell to find the corrected Chi-Square statistic.
- Sum the values obtained from the corrected formula for all cells to get the final Chi-Square statistic.
- Compare the final Chi-Square statistic to the critical value from the Chi-Square distribution table with 1 degree of freedom to determine significance.
Here's an example:
| Category | Group 1 | Group 2 |
|---|---|---|
| Outcome 1 | O11 = 20 | O12 = 30 |
| Outcome 2 | O21 = 10 | O22 = 40 |
Calculate the expected frequencies (Eij) for each cell:
- \(E_{11} = \frac{(30 \times 50)}{100} = 15\)
- \(E_{12} = \frac{(70 \times 50)}{100} = 35\)
- \(E_{21} = \frac{(30 \times 50)}{100} = 15\)
- \(E_{22} = \frac{(70 \times 50)}{100} = 35\)
Apply the Yates' correction:
- \(X^2 = \frac{(|20 - 15| - 0.5)^2}{15} + \frac{(|30 - 35| - 0.5)^2}{35} + \frac{(|10 - 15| - 0.5)^2}{15} + \frac{(|40 - 35| - 0.5)^2}{35}\)
- \(X^2 = \frac{(4.5)^2}{15} + \frac{(4.5)^2}{35} + \frac{(4.5)^2}{15} + \frac{(4.5)^2}{35}\)
- \(X^2 = 1.35 + 0.58 + 1.35 + 0.58 = 3.86\)
If the critical value from the Chi-Square table at 1 degree of freedom (usually 3.841 at p = 0.05) is less than 3.86, then we reject the null hypothesis, indicating a significant association between the variables.
Examples of Chi Square Test
The Chi Square test can be applied in various scenarios where you want to determine if there is a significant association between categorical variables. Here are some detailed examples to illustrate its application:
Example 1: Voting Preference and Gender
Researchers surveyed 500 voters to determine if gender is associated with political party preference. The data collected is summarized in a 2x2 contingency table:
| Gender | Party A | Party B |
|---|---|---|
| Male | 150 | 100 |
| Female | 120 | 130 |
The Chi Square test is used to determine if the difference in political party preference between genders is statistically significant.
Example 2: Favorite Color and Favorite Sport
Researchers surveyed 100 people to find out if there is an association between a person's favorite color and their favorite sport. The results are presented in a 2x2 table:
| Favorite Color | Sport A | Sport B |
|---|---|---|
| Red | 30 | 20 |
| Blue | 10 | 40 |
The Chi Square test will help to determine if there is a significant relationship between the favorite color and the favorite sport.
Example 3: Education Level and Marital Status
A study was conducted on 2,000 individuals to find out if there is a correlation between education level and marital status. The data is summarized in the following table:
| Education Level | Married | Single |
|---|---|---|
| High School | 300 | 200 |
| College | 400 | 500 |
Using the Chi Square test, researchers can determine if education level is associated with marital status.
In each of these examples, the Chi Square test of independence is used to analyze the data and draw conclusions about the relationships between the variables.
Assumptions of Chi Square Test
The Chi Square Test is widely used to determine if there is a significant association between two categorical variables in a contingency table. However, several key assumptions must be met for the test to yield valid results:
- Categorical Variables: Both variables under consideration should be categorical. Examples include categories like "male/female" or "smoker/non-smoker".
- Independence: Observations must be independent of each other, meaning the value of one observation should not influence the value of another.
- Mutually Exclusive Cells: Each entry in the table must fall into only one cell. No individual observation should be counted in more than one category.
- Expected Cell Frequencies: The expected frequency for each cell should be at least 5 in at least 80% of the cells, and no cell should have an expected frequency less than 1. If this assumption is violated, consider using Fisher's Exact Test instead.
Ensuring these assumptions are met is critical for the Chi Square Test to provide accurate and reliable results. If the assumptions are not satisfied, the test's conclusions may not be valid.
Using Chi Square Calculator
The Chi Square Calculator is a useful tool for analyzing 2x2 contingency tables. It helps determine if there is a significant association between two categorical variables. Here’s a step-by-step guide on how to use it:
- Enter Data: Label your rows and columns with the appropriate categories. For example, if analyzing smoking and lung cancer, your rows could be "Smoking" and "Non-Smoking", and your columns could be "Lung Cancer" and "No Lung Cancer".
- Input Observed Values: Enter the actual counts for each combination in the table. Ensure the data is in whole numbers, not percentages.
- Calculate Expected Values: The calculator will compute the expected values based on the marginal totals of the observed data. The expected count for each cell is calculated using the formula:
\[ E = \frac{(row \ total \times column \ total)}{grand \ total} \]
- Compute Chi Square Statistic: The calculator will use the formula:
\[ \chi^2 = \sum \frac{(O - E)^2}{E} \]where \(O\) is the observed frequency and \(E\) is the expected frequency for each cell. This sums the squared difference between observed and expected counts, divided by the expected count.
- Interpret Results: The Chi Square statistic and the p-value will indicate whether there is a significant association between the variables. A p-value less than 0.05 typically suggests a significant association.
Using a chi square calculator simplifies these steps, ensuring accurate calculations and aiding in the correct interpretation of your data.

Chi Square vs. Other Statistical Tests
The Chi Square test is a powerful statistical tool used to determine if there is a significant association between two categorical variables. However, it's not the only test available for analyzing categorical data. Here, we compare the Chi Square test with other common statistical tests:
- Fisher’s Exact Test
- G-Test
- T-Test
- ANOVA (Analysis of Variance)
- McNemar’s Test
Fisher’s Exact Test is used for examining the significance of the association between two kinds of classifications, particularly when sample sizes are small. It is an exact test, meaning that it doesn't rely on approximations, unlike the Chi Square test. It's best suited for 2x2 contingency tables.
| Advantages: | Exact p-value calculation, suitable for small sample sizes. |
| Disadvantages: | Computationally intensive for larger tables, less informative for larger datasets. |
The G-Test is another test for goodness of fit and independence that uses the likelihood ratio. It's considered to be more robust in certain conditions compared to the Chi Square test.
| Advantages: | More accurate for small expected frequencies. |
| Disadvantages: | Less intuitive than Chi Square test. |
The T-Test is used to determine if there is a significant difference between the means of two groups. It is not used for categorical data but for comparing means in continuous data.
| Advantages: | Suitable for comparing means of two groups, widely used. |
| Disadvantages: | Not applicable to categorical data. |
ANOVA is used to compare the means of three or more samples to see if at least one sample mean is different from the others. Like the T-Test, it is used for continuous data rather than categorical data.
| Advantages: | Handles multiple groups, useful for more complex designs. |
| Disadvantages: | Assumes normal distribution and homogeneity of variances. |
McNemar’s Test is used on paired nominal data. It's particularly useful for before-and-after studies to assess if there are changes in the proportions of two related samples.
| Advantages: | Suitable for paired samples, simple to compute. |
| Disadvantages: | Only applicable to 2x2 tables with paired samples. |
When choosing the appropriate statistical test, consider the type of data you have, the size of your samples, and the specific hypotheses you are testing. Each test has its own strengths and weaknesses, making them suitable for different scenarios.
Common Mistakes in Chi Square Analysis
Chi Square analysis is a widely used statistical method for examining the relationship between categorical variables. However, several common mistakes can undermine the validity of the results. Here are the most frequent errors and how to avoid them:
-
Using Percentages Instead of Frequencies:
Chi Square calculations require raw frequency counts, not percentages. Using percentages can misrepresent the sample size and lead to incorrect conclusions. Always use the actual count of observations in each category.
-
Non-Exhaustive Categories:
Every possible category must be included in the analysis. Omitting a category can skew the results. Ensure that all categories, even those with zero counts, are represented in your data.
-
Non-Mutually Exclusive Categories:
Each data point must fit into one and only one category. Overlapping categories violate the assumption of independence, leading to invalid results. Carefully define your categories to avoid overlap.
-
Small Sample Sizes:
Chi Square tests are sensitive to sample size. It is generally recommended to have an expected frequency of at least 5 in each cell of the contingency table. For smaller samples, consider using Fisher's exact test instead.
-
Non-Random Sampling:
The sample must be randomly selected to generalize the results. Non-random samples can introduce bias, affecting the test's validity. Ensure your sampling method is random and representative of the population.
-
Ignoring Assumptions:
Chi Square tests assume that the data are independently distributed. Violations of this assumption can lead to incorrect conclusions. Check that your data meet all necessary assumptions before performing the test.
By avoiding these common mistakes, you can ensure that your Chi Square analysis is accurate and reliable, providing meaningful insights into the relationships between your categorical variables.
Advanced Topics in Chi Square Testing
The Chi Square test is a versatile statistical tool used for hypothesis testing in categorical data. Advanced topics in Chi Square testing expand its application and enhance its accuracy. Here are some key advanced topics:
1. Chi Square Test for Larger Contingency Tables
While the 2x2 table is common, Chi Square tests can be extended to larger tables, such as 3x3 or more. This allows for analysis involving more categories and complex relationships.
2. Fisher's Exact Test
For small sample sizes, Fisher's Exact Test is an alternative to the Chi Square test. It provides an exact p-value, which is more reliable when expected frequencies in cells are low.
- Used when sample sizes are small.
- Calculates exact p-values, avoiding the approximation errors of Chi Square.
3. Yates' Continuity Correction
Yates' correction for continuity is applied to the Chi Square test to reduce overestimation of statistical significance in 2x2 tables.
- Useful for small sample sizes.
- Adjusts the Chi Square formula to be more conservative.
4. Chi Square Goodness of Fit Test
This test determines how well observed data fit a particular distribution. It's useful for single categorical variables.
- Compares observed frequencies to expected frequencies based on a theoretical distribution.
- Tests the hypothesis that the observed distribution matches the expected distribution.
5. Power Analysis for Chi Square Tests
Power analysis determines the sample size needed to detect an effect of a given size with a certain degree of confidence. It's crucial for designing experiments and ensuring adequate sample sizes.
- Helps to avoid Type II errors (failing to detect an effect when there is one).
- Calculates the minimum sample size required for reliable results.
6. Cramer's V
Cramer's V is a measure of association between two nominal variables, providing a value between 0 and 1 to indicate the strength of association.
- Used when Chi Square test shows a significant result.
- Helps to understand the strength and direction of the relationship.
7. Chi Square Test for Trend
This test is used for ordinal data to detect trends across ordered categories. It is particularly useful in epidemiology and social sciences.
- Analyzes data where categories have a natural order.
- Tests for trends rather than just associations.
8. Log-Linear Models
For multidimensional contingency tables, log-linear models extend the Chi Square test to analyze interactions between more than two categorical variables.
- Useful for complex datasets with multiple categorical variables.
- Allows for analysis of higher-order interactions.
9. Monte Carlo Simulation
Monte Carlo simulation is used to approximate the distribution of the Chi Square statistic when exact calculations are infeasible.
- Useful for complex models and large datasets.
- Provides an empirical distribution of the test statistic.
10. Bayesian Chi Square Tests
Bayesian methods provide an alternative framework for Chi Square tests, incorporating prior information into the analysis.
- Combines prior beliefs with observed data.
- Useful when prior information is available and relevant.
These advanced topics enhance the utility and accuracy of the Chi Square test, making it a powerful tool in statistical analysis.
Graphing Chi Square Results
Graphing Chi Square results is crucial for effectively visualizing the relationships between categorical variables. Different types of graphs can be used to represent Chi Square data, making it easier to interpret and communicate findings.
Here are the steps to graph Chi Square results:
- Identify the Variables: Determine the categorical variables you want to compare. This will guide the choice of graph type.
- Select the Appropriate Graph Type: Choose a graph that best represents the relationship between the variables. Common types include:
- Bar Graphs: Useful for comparing the frequencies of different categories and highlighting disparities or trends.
- Pie Charts: Ideal for showing the proportion of each category within the dataset.
- Stacked Bar Graphs: Effective for displaying the relationship between two categorical variables, showing how one variable is distributed across levels of another.
- Mosaic Plots: Specialized for visualizing residuals and associations in Chi Square analysis.
- Create the Graph: Use tools like Excel, SPSS, or R to create the selected graph based on frequencies or percentages from your Chi Square analysis.
- Label and Annotate: Clearly label your graph with informative titles, axis labels, and legends to guide interpretation.
- Evaluate and Refine: Review the graph to ensure it accurately represents the Chi Square results. Adjust for clarity and better understanding.
Graphing Chi Square results not only enhances interpretability but also makes patterns and trends more apparent, facilitating better insights into the data. Here are some tips for improving Chi Square graphs:
- Choose Appropriate Colors: Use colors that differentiate categories clearly without being overwhelming.
- Simplify Labels: Keep labels concise and informative to avoid clutter.
- Use Annotations: Add annotations to highlight significant findings or interesting patterns.
- Maintain Consistent Formatting: Ensure consistent use of fonts, colors, and graph styles for better readability.
- Opt for Simple Layouts: Avoid overly complex designs that can obscure the data.
By following these steps and tips, you can create effective and visually appealing graphs that make your Chi Square results easy to understand and interpret.

Tính Toán Chi-square cho Bảng 2X2
READ MORE:
Kiểm Tra Độc Lập Chi-square (Kiểm Tra Chi-square cho Bảng Hai Chiều)